Fig. 5.
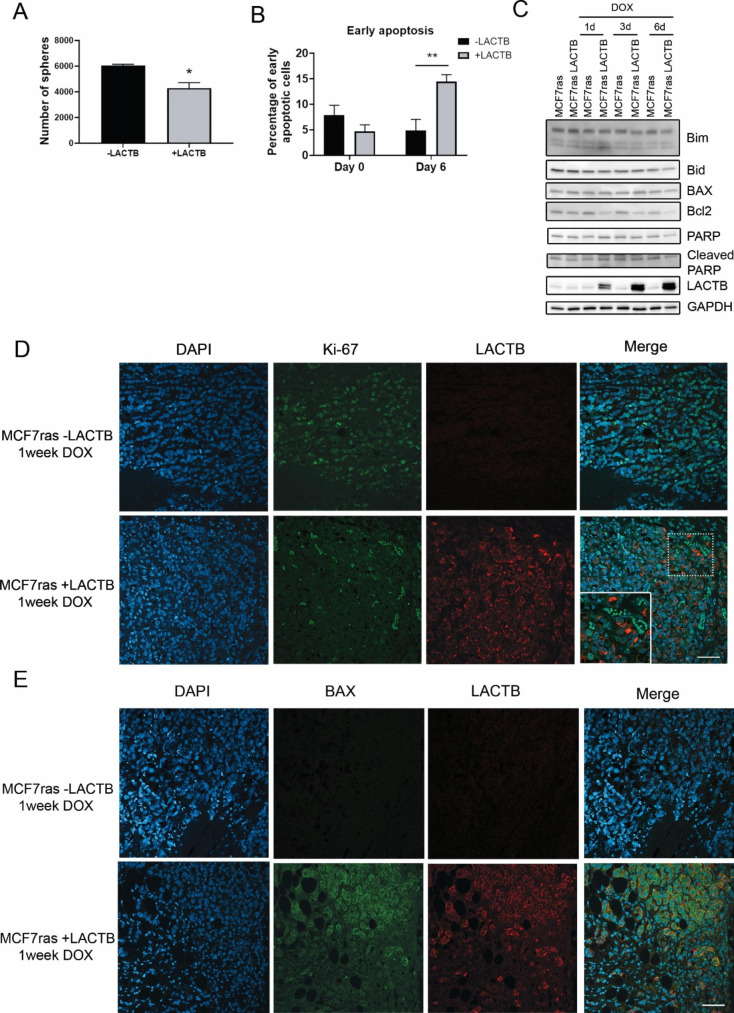
The effect of LACTB induction under 3D and in vivo conditions. (A) Number of spheres in control MCF7ras cells and MCF7ras where LACTB was induced for 6 days. Average ± SD of three experiments are plotted in the graph. (B) FACS analysis of Annexin V staining in spheres with and without LACTB induction. Early apoptosis was considered. (C) Western blot analysis of apoptotic pathways in MCF7ras spheres after LACTB induction for the indicated time points. (D and E) Immunofluorescence analysis of tissue sections of control (MCF7ras -LACTB) and cells overexpressing LACTB (MCF7ras + LACTB) after one week of treatment with DOX Samples were stained with Ki-67 and BAX (E) to examine the proliferation and cell death, respectively. Scale bar: 50 μm. *P < 0.05; **P < 0,01 vs. cells not expressing LACTB.

