
Figure 7.
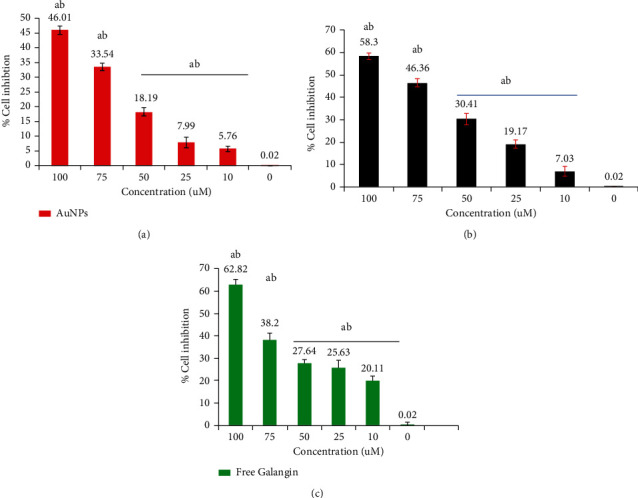
Cytotoxicity and growth cell inhibition determined by MTT assay on MDA-MB-231 human breast cancer cell growth exposed to (a) AuNPs, (b) AuNPs-GAL, and (c) GAL at different concentrations (10, 25, 50, 75, and 100 μM). Statistical analysis indicates (a) significant difference compared to the control group and (b) significant difference between groups. Data are mean ± SD from three independent experiments.