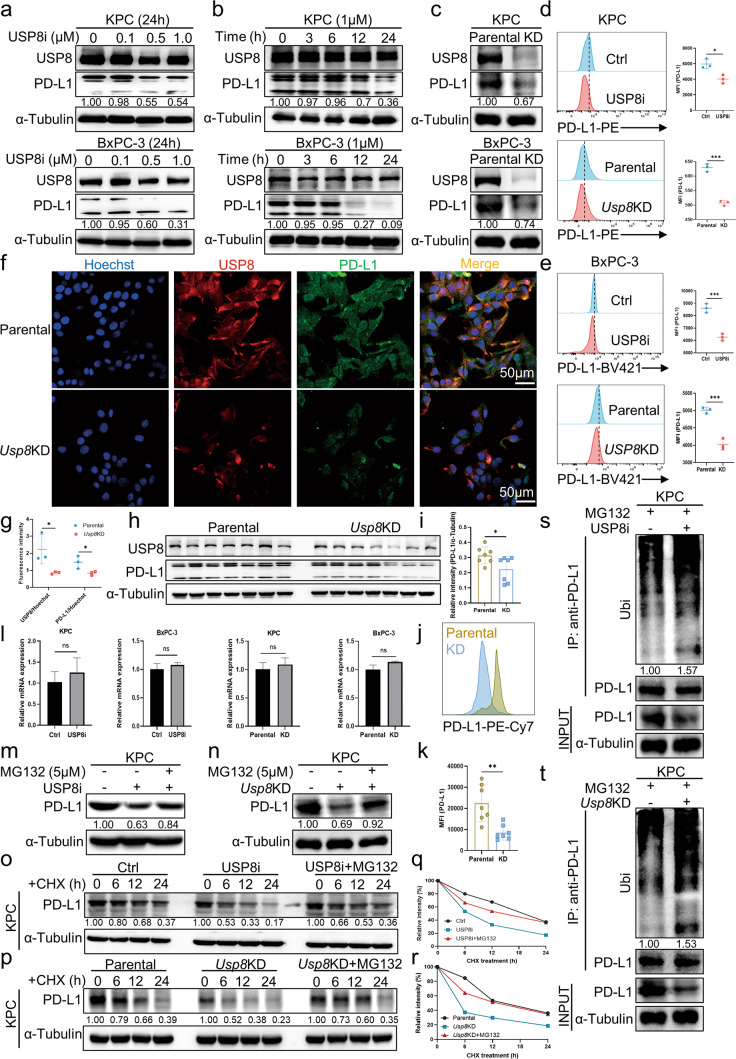
Fig. 4. Ubiquitination-mediated degradation of PD-L1 by proteasomes is inhibited by USP8.
a–c Levels of PD-L1in pancreatic cancer cell lines (KPC, BxPC-3) treated with a concentration gradient and time gradient of the USP8 inhibitor and after Usp8 knockdown, as assessed using western blotting. The image is representative of three independently performed experiments. d, e Statistical analysis of the levels of PD-L1 in pancreatic cancer cell lines treated with the USP8 inhibitor (1 μM, 24 h) and Usp8 KD and subjected to flow cytometry. A representative image of three independent experiments is shown. f Photographs of immunofluorescence staining showing USP8 and PD-L1 expression in parental and Usp8-depleted KPC cells, and the statistical analysis of the results (g). The image is representative of three independently performed experiments. h–k Statistical analysis of USP8 and PD-L1 levels in tumor samples, as assessed using flow cytometry and western blotting analyses. l Statistical analyses of the qRT-PCR results showing PDL1 mRNA levels in pancreatic cancer cell lines treated with the USP8 inhibitor (1 μM, 24 h) and Usp8 knockdown. A representative image of three independent experiments is shown. m The level of PD-L1 after USP8 inhibitor (1 μM, 24 h) treatment in KPC cells treated with MG132 (5 μM, 12 h), as assessed using western blotting. A representative image of three independent experiments is shown. n The level of PD-L1 in MG132 (5 μM, 12 h)-treated parental and Usp8 KD KPC cells, as assessed using western blotting. A representative image of three independent experiments is shown. o Analysis of PD-L1 stability in cycloheximide (CHX) (200 μg/mL) pretreated KPC cells incubated with the USP8 inhibitor (1 μM, 24 h). A representative image of three independent experiments is shown. p Analysis of PD-L1 stability in cycloheximide (CHX) (200 μg/mL) treated parental and Usp8 KD KPC cells. A representative image of three independent experiments is shown. q, r, A densitometer was used to quantify the intensity of PD-L1 protein expression and the results are representative of three independent experiments. s Assay of PD-L1 ubiquitination in KPC cells. The cells were treated with MG132 (5 μM, 12 h) followed by USP8 inhibitor (1 μM, 24 h) treatment and then western blotting was used to detect PD-L1 and ubiquitin. t Assay of PD-L1 ubiquitination in parental and Usp8 KD KPC cells. Cells were treated with MG132 (5 μM, 12 h) then western blotting was used to detect PD-L1 and ubiquitin. Results are shown as the means ± SD of representative experiments in (d, e, g, i, k, l, q and r). The data represent three independent experiments. *p < 0.05, **p < 0.01, **p < 0.001 assessed via a two-tailed t test; ns: not significant.

