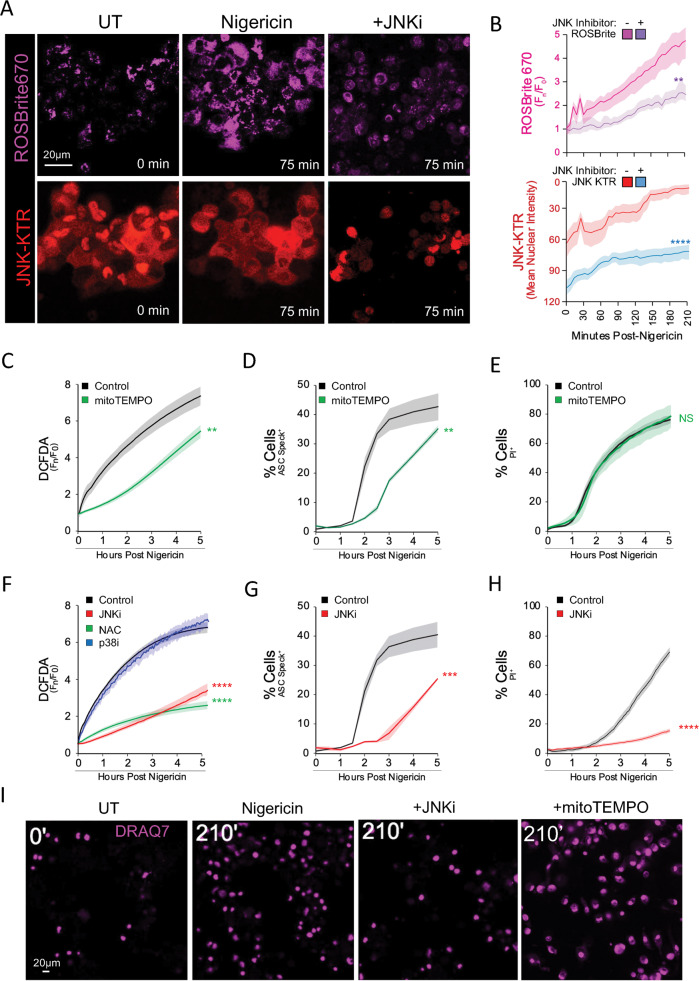
Fig. 3. Trigger-Induced JNK Activity Spurs Mitochondrial ROS Production to Tune Inflammasome Formation.
A, B Live confocal imaging of ROS production via ROSBrite670 in the stable THP1 mKTR B6 line triggered with 10 µM nigericin compared to cells pretreated with 30 µM JNK-IN-8 (A) and accompanying quantitation (B). C, E, F, H, I Live epifluorescent imaging quantitation of hMDM labeled with green-shifted chemical biosensor (DCFDA) to measure ROS production (C, F), PI (E, H), or Draq7 (I) to assess cell permeation following a 10 µM nigericin trigger ±30 µM JNK-IN-8 (JNKi), 10 µM SB203580 (p38αi), 30 µM doramapimod (p38i), 5 mM N-acetyl cysteine (NAC), or 300 µM mitoTEMPO. D, G Endogenous hMDM ASC speck quantitation performed by high-content imaging under inhibitor conditions described above. B Line plots of data summarized from at least 200 cells, as in Fig. 2D, represent gated mean cellular fluorescence for each biosensor while shading represents one standard deviation from the mean. Two-way ANOVA followed by Tukey’s multiple comparison test; **p < 0.01, ***p < 0.001, ****p < 0.0001. A–I Imaging is representative of two (C, D, F, G) or three (A, B, E, H, I) independent experiments consisting of four (A, B), ten (C, E, F, H, I), or 20 (D, G) independent fields per condition.

