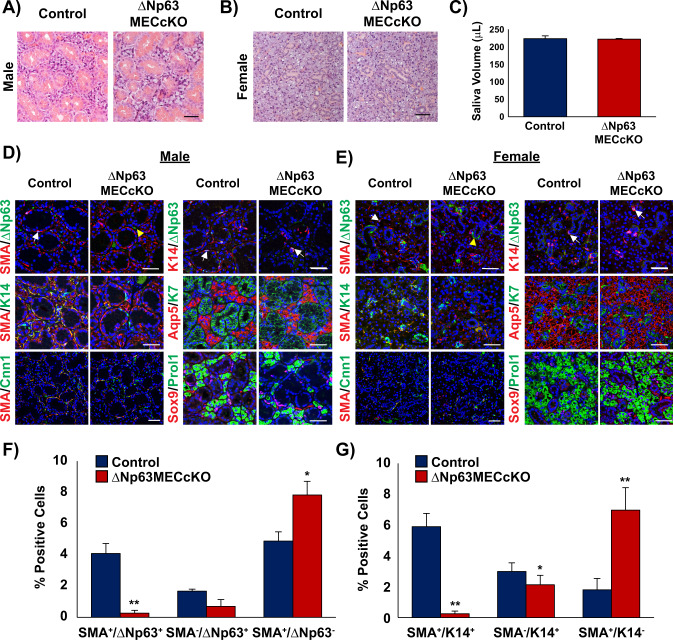
Fig. 1. Histological and immunochemical analysis of submandibular salivary glands of mice with targeted deletion of ΔNp63 in the MECs.
Hematoxylin and eosin (H&E) staining of A male and B female control and ΔNp63MECcKO submandibular glands 2 months post ΔNp63 deletion. C Saliva volume of the control and ΔNp63MECcKO mice 2 months post TAM administration. Immunochemical analysis of D male and E female control and ΔNp63MECcKO salivary glands show that the SMA+/ΔNp63+ and SMA+/K14+ double positive myoepithelial cell subpopulation decreases upon deletion of ΔNp63 in the MECs. Deletion of ΔNp63 in the myoepithelial cells does not appear to affect the other cell lineages as the acinar and ductal markers remain unchanged. White arrows indicate SMA+/ΔNp63+ MECs or ΔNp63+/K14+ basal cells. Yellow arrows depict background staining. Myoepithelial and basal cell marker: SMA, Cnn1, ΔNp63, K14; acinar cell marker: Aqp5, Prol1; ductal cell marker; K7, Sox9. Scale bar: 50 µm. (n = 4). F Quantification of SMA and ΔNp63 positive cells upon targeted deletion of ΔNp63. (n = 3). G Quantification of SMA and K14 positive cells upon targeted deletion of ΔNp63. Data are represented as mean ± standard deviation (SD) (n = 3). *p < 0.05, **p < 0.01. White arrows indicate p63+ cells, yellow arrows indicate non-specific p63 staining. Immunofluorescence staining colors: Yellow-green and red co-localization, Pink-red and blue (nuclei) co-localization, Turquoise-green and blue co-localization.

