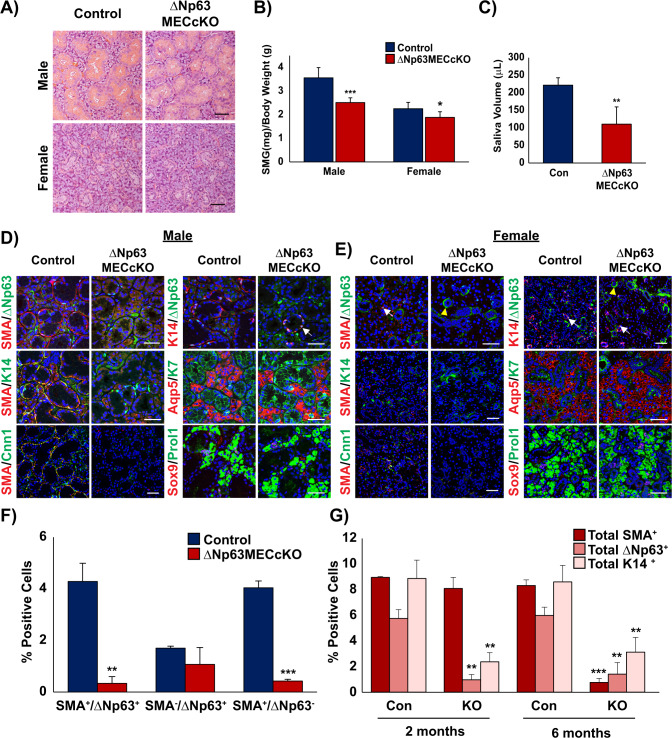
Fig. 2. Histological and immunochemical analysis of submandibular salivary glands 6 months post ΔNp63 deletion in the MECs.
A H&E staining of male and female control and ΔNp63MECcKO SMGs 6 months post ΔNp63 specific deletion in the MECs. B Submandibular gland weights of the male and female control and ΔNp63MECcKO mice 6 months post ΔNp63 ablation. C Saliva volume was measured from control and ΔNp63MECcKO mice 6 months following TAM administration. Immunofluorescence staining of D male and E female control and ΔNp63MECcKO SMGs demonstrates the dramatic loss of the MECs as shown by loss of SMA and Cnn1 expression. Basal, acinar, and ductal cell populations are still present in the ΔNp63MECcKO SMGs. White arrows show SMA+/ΔNp63+ MECs or ΔNp63+/K14+ basal cells. Yellow arrows depict background staining. Scale bar: 50 µm. F Quantification of SMA+ and ΔNp63+ cells 6 months post-TAM administration, shows a significant loss of the myoepithelial cell lineage. (n = 3). G Percentage of the total SMA, p63, K14 positive cells per total number of cells (total nuclei) in the control and ΔNp63MECcKO glands 2 months and 6 months post ΔNp63 MEC deletion. Data are represented as mean ± standard deviation (SD) (n = 3). *p < 0.05, **p < 0.01, ***p < 0.001. White arrows indicate p63+ cells, yellow arrows indicate non-specific p63 staining. Immunofluorescence staining colors: Yellow-green and red co-localization, Pink-red and blue (nuclei) co-localization, Turquoise-green and blue co-localization.

