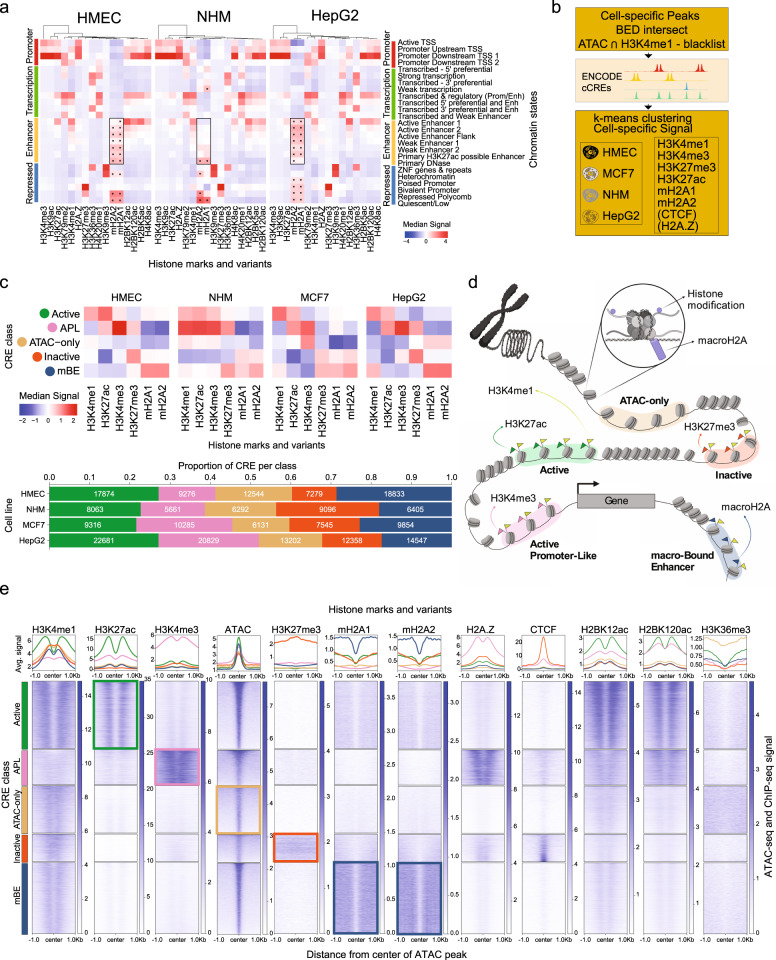
Fig. 1. Characterization of macro-Bound Enhancers.
a Heatmaps showing median signal scores of 14 histone marks from the Roadmap reference human epigenomes (imputed ChIP-Seq signal tracks for E119, E059 and E118) and that of histone variants macroH2A.1 and macroH2A.2 (signal tracks from ChIP-Seq experiments), across all genomic regions in the 25-state chromatin models from Roadmap, built for human mammary epithelial cells (HMEC), normal human melanocytes (NHM) and the human hepatocellular carcinoma cell line (HepG2), respectively. All values are centered and scaled along the column direction. Median signal scores of macroH2A variants in the enhancer states are highlighted using a box. MacroH2A variants enrichments that are statistically significant (p < 0.05, one-sided Mann–Whitney U test with Bonferroni correction) are marked with an asterisk. b Outline of algorithm used to classify cell-specific cis-regulatory elements (CRE). c Heatmaps showing median Z scores of the log-normalized input-corrected ChIP-seq signal of 6 histone marks/variants used in classifying the CRE sites in each CRE class (top). Bar plot (bottom) shows the proportion of CRE classes in each cell type. d Illustration showing each CRE class with corresponding marks (histone modifications or variants). e Average signal profile (top) and heatmaps (bottom) of ATAC-seq signal scores, and ChIP-seq signal scores of histone marks and variants around open chromatin regions (defined by ATAC-seq) grouped by the five CRE classes in HMEC.

