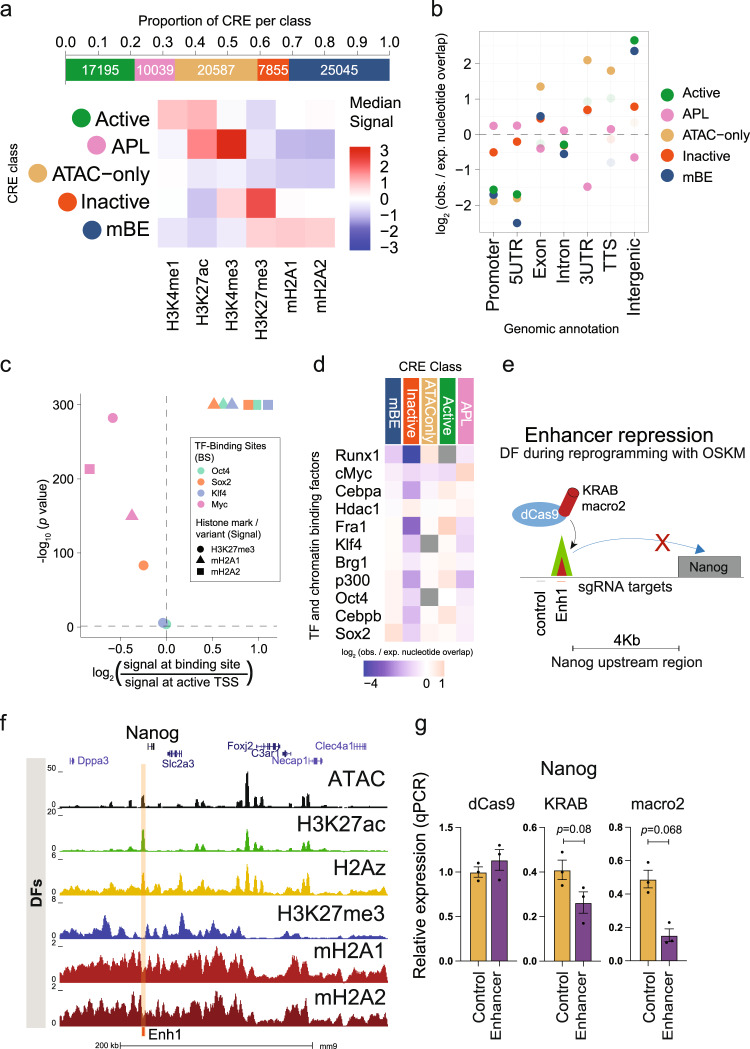
Fig. 3. MacroH2A is a negative modulator of enhancer activity.
a Proportion of CRE peaks in each CRE class (top) and heatmap (bottom) showing median Z scores of the log-normalized input-corrected ChIP-seq signal of the 6 histone marks/variants used in classifying the CRE peaks in each class in dermal fibroblasts (DF). b Genomic region enrichment of the CRE peaks in each class as calculated by GAT (enrichments that are statistically significant, Benjamini-Hochberg corrected p-value < 0.05, are shown in darker colors, and the rest in lighter colors). c Volcano plot showing the enrichment of the signals of macroH2A variants and H3K27me3 at the binding sites (BS) of Oct4, Sox2, Klf4 and cMyc (48 h after OSKM induction, binding sites data collected from Chronis et al.37), relative to the signals at active TSS (AT) regions in dermal fibroblasts (Mann–Whitney U test). Active TSS (AT) regions are defined as 500 bp up- and downstream of the transcription start sites that have RPKM > 1 measured by RNA-seq experiments on dermal fibroblasts. d Enrichment of TF and chromatin binding factors after 48 h of OSKM expression37, at CRE sites of DF cells as calculated by GAT, ranked by enrichment in mBE (enrichments that are not statistically significant, Benjamini-Hochberg corrected p-value > 0.05, are shown in gray). e Schematic of enhancer targeting in DF during reprogramming with OSKM using dCas9-KRAB and dCas9-macro2 and sgRNAs complementary to regions around the enhancer site. f UCSC genome browser snapshot of the Klf4 binding site upstream of the Nanog TSS in DF with open chromatin (ATAC-seq), H3K27me3, H3K27ac, H2A.Z, mH2A1 and mH2A2 data. g Nanog relative expression after 96 h of OSKM infection in DFs with dCas9, dCas9-KRAB or dCas9-macro2 (unpaired two tailed student’s t-test, p = 0.068) with sgRNAs targeting the enhancer site upstream of Nanog or control. Data are mean with SE (n = 3).

