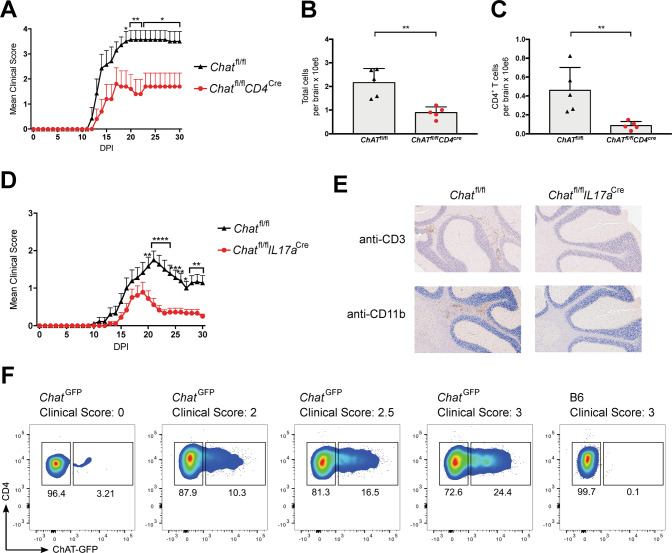
Fig. 1. T cell-specific ChAT deficiency reduces EAE severity.
A EAE clinical scores of Chatfl/fl (n = 7) and Chatfl/flCD4cre (n = 5) mice immunized with an emulsion containing MOG35–55 plus Complete Freund’s Adjuvant (CFA) and pertussis toxin (PTX). DPI, days post-immunization. Mean clinical score: 0, no disease; 1, decreased tail tone or mild balance defects; 2, hind limb weakness, partial paralysis or severe balance defects that caused spontaneous falling over; 3, complete hind limb paralysis or very severe balance defects that prevented walking; 4, front and hind limb paralysis or inability to move the body into a different position; 5, moribund state. B Quantitation of absolute numbers of viable brain-infiltrating immune cells per brain from the Chatfl/fl and Chatfl/flCD4cre mice in A at day 30 post-EAE induction as determined by flow cytometry. C Quantitation of absolute numbers of brain-infiltrating total Th cells (CD3+CD4+) in the brain suspensions in B. D EAE clinical scores of Chatfl/fl (n = 18) and Chatfl/flIl17acre (n = 18) mice immunized as in A. E Histological analyses of the brains of the mice in D on day 30 post-EAE induction. Cross-sections of the same brain areas were stained with anti-CD3 antibody (to detect T cells) or anti-Mac-1 (CD11b) antibody (macrophages, activated microglia). Scale bars, 200 μm. Results shown are for one mouse/genotype representative of three mice/group. F Representative flow cytometric analysis of ChatGFP mice or B6 wild type (WT) control animals (n = 4/group) that were immunized as in A and analyzed on day 21 post-immunization to detect ChAT-GFP+ Th cells. Corresponding clinical scores are indicated. For all applicable panels, data are the mean ± s.e.m. *P < 0.05, **P < 0.01, ***P < 0.001, ****P < 0.0001. For A, D, significance was determined by regression analysis with two-way analysis of variance (ANOVA) followed by Bonferroni post hoc multiple comparison test; (B, C) Student’s t-test (two-sided). Data are representative of three (A, F) or two (D) independent experiments.

