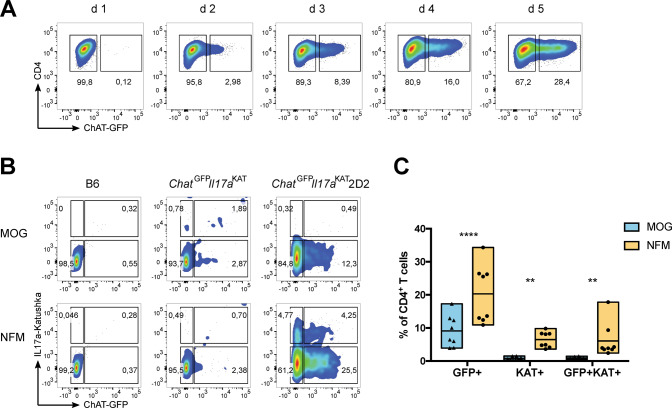
Fig. 3. Antigen affinity determines ChAT expression in Th17 cells.
A Representative flow cytometric analysis of the kinetics over 5 days of ChAT-GFP expression in naïve CD4+ T cells that were polarized towards the Th17 cell fate through stimulation with plate-bound anti-CD3 plus soluble anti-CD28 in the presence of PM. B Representative flow cytometric analysis of ChAT-GFP expression by CD4+ T cells among total splenocytes that were isolated from mice of the indicated genotypes and cultured for 3 days in the presence of PM plus either MOG or NFM peptide (0.4 mM). C Quantitation of the data shown in B. Each data point represents a technical replicate, with a total of 4 biological replicates, from a combination of two independent experiments. Data in A and B are representative of two independent experiments.

