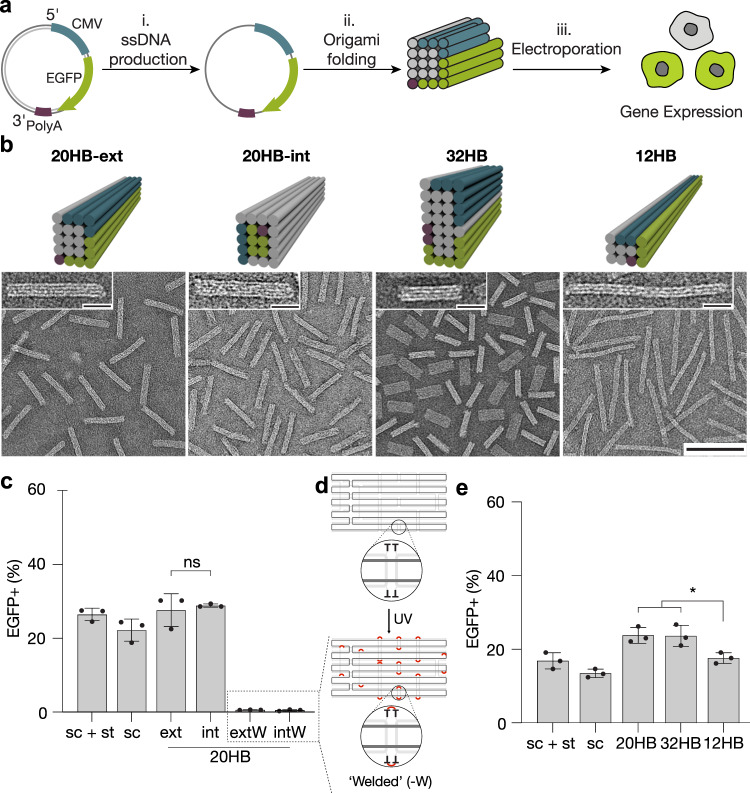
Fig. 1. Folding and expressing genes from origami structures.
a Schematics of the overall workflow: ssDNA is produced from plasmid DNA via phagemids (i), and then folded into 20 helix bundle (20HB) DNA origami objects (ii). Objects were delivered to cells, and gene expression from the origami structure was assessed by detection of positive fluorescence read-out (iii). CMV promoter sequence is shown in blue, gene encoding for enhanced green fluorescent protein (EGFP) in green, and the bGH polyadenylation signal (polyA) in purple. b Cylinder models and negative-staining transmission electron micrographs of the 20HB, 12HB and 32 HB are given in the upper and lower panels, respectively (scale bar 100 nm, insets 20 nm). Coloring demonstrates the positions of the scaffold features, for example 20HB-ext demonstrates the CMV (blue), EGFP (green) and polyA (purple) encoding sequences present along exterior helices, while 20HB-int presents the sequences encoding for EGFP and polyA within interior helices. c Transfection efficiency in HEK293T cells. d Schematics explaining internal crosslinking via UV irradiation. For UV-welded structures 20HB-ext-W and 20HB-int-W, EGFP expression was silenced. e Transfection efficiency in HEK293T cells by electroporation seen for 20HB(-ext), 32HB and 12HB structures. 12HB structure demonstrated lower transfection efficiency (EGFP + cells) than 20HB (p = 0.0287) and 32HB structures (p = 0.0325). Data collected in c and e were quantified using flow cytometry and are presented as mean ± standard deviation (s.d.) for n = 3 biologically independent experiments, source data provided. Individual data points are overlaid, controls are unfolded scaffold and staple mixture ‘sc + st’ and scaffold only ‘sc’, 0.5 µg total DNA per condition. Statistical analysis was performed using one-way ANOVA with Tukey’s multiple comparison (*p ≤ 0.05, ns p > 0.05). Corresponding EGFP-encoding plasmid was used as a positive control, given in Supplementary Fig. 6.

