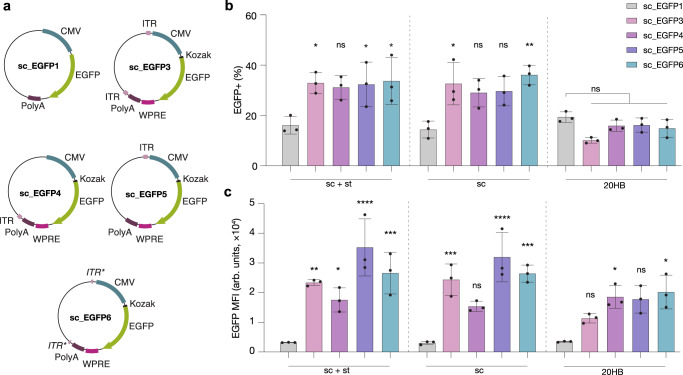
Fig. 3. Enhanced gene expression from alternative scaffold sequences.
a Scaffold designs where sc_EGFP1 represents the initial scaffold design, and sc_EGFP3/4/5/6 include additional sequence features such as ITRs (light pink), or ITR binding domains (ITR*), Kozak sequence (black), and WPRE (dark pink). b, c Comparison of transfection efficiency in HEK293T cells as determined by EGFP+ cells (b) and mean fluorescent intensity of EGFP+ cells (c). For condition sc + st, scaffold sc_EGFP3 (p = 0.0267), sc_EGFP5 (p = 0.0361) and sc_EGFP6 (p = 0.0168) demonstrated a higher percentage of EGFP+ cells, while scaffolds sc_EGFP3 (p = 0.0011), sc_EGFP4 (p = 0.0499), sc_EGFP5 (p = 3.10 × 10⁻⁷) and sc_EGFP6 (p = 0.0001) demonstrated higher MFI compared to sc_EGFP1. For condition sc, scaffold sc_EGFP3 (p = 0.0118) and sc_EGFP6 (p = 0.0014) demonstrated higher percentage of EGFP+ cells, while scaffolds sc_EGFP3 (p = 0.0005), sc_EGFP5 (p = 2.52 × 10⁻⁶) and sc_EGFP6 (p = 0.0001) demonstrated higher MFI compared to sc_EGFP1. For 20HB structures, only those folded with sc_EGFP4 (p = 0.0317) and sc_EGFP6 (p = 0.0113) demonstrated higher EGFP MFI than 20HBs folded with sc_EGFP1. Data is replotted in Supplementary Fig. 14. Data collected in b and c were quantified using flow cytometry and are presented as mean ± s.d. for n = 3 biologically independent experiments, individual data points are overlaid, controls are unfolded scaffold and staple mixture ‘sc + st’ and scaffold only ‘sc’, 0.5 µg total DNA per condition, source data provided. Statistical analysis was performed using one-way ANOVA with Tukey’s multiple comparison (*p ≤ 0.05, **p ≤ 0.01, ***p ≤ 0.001, ****p ≤ 0.0001, ns p > 0.05).

