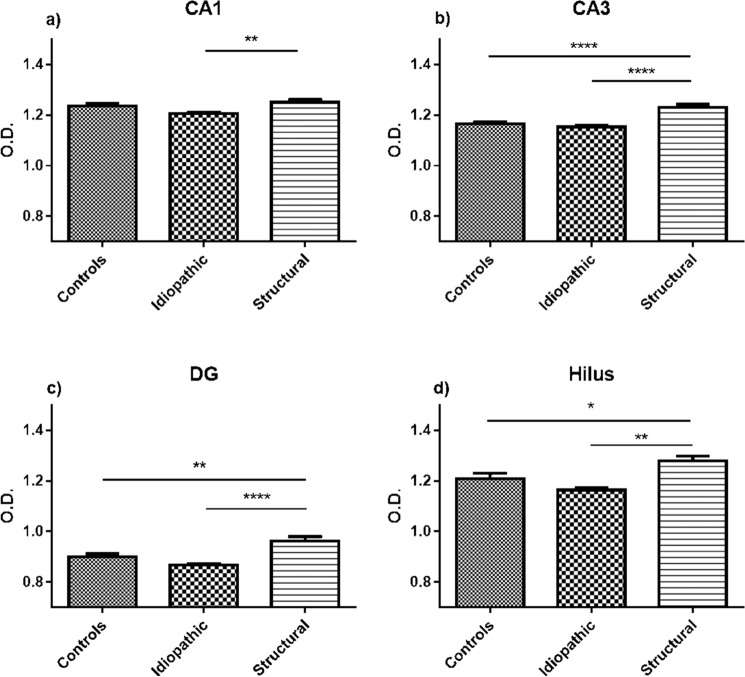
Figure 3.
Analysis of intensity of CB1R expression in the hippocampus. In hippocampal sub-regions CA1 (a) CA3 (b), DG (c) and hilus (d) the structural epilepsy group showed higher O.D. compared to the idiopathic epilepsy group. Additionally, an increase in O.D. was detected in the structural epilepsy group compared to the control group. Error bars indicate SEM, *p < 0.05, **p < 0.01, ***p < 0.0001; CA: Cornu Ammonis; DG: dentate gyrus; O.D: optical density.

