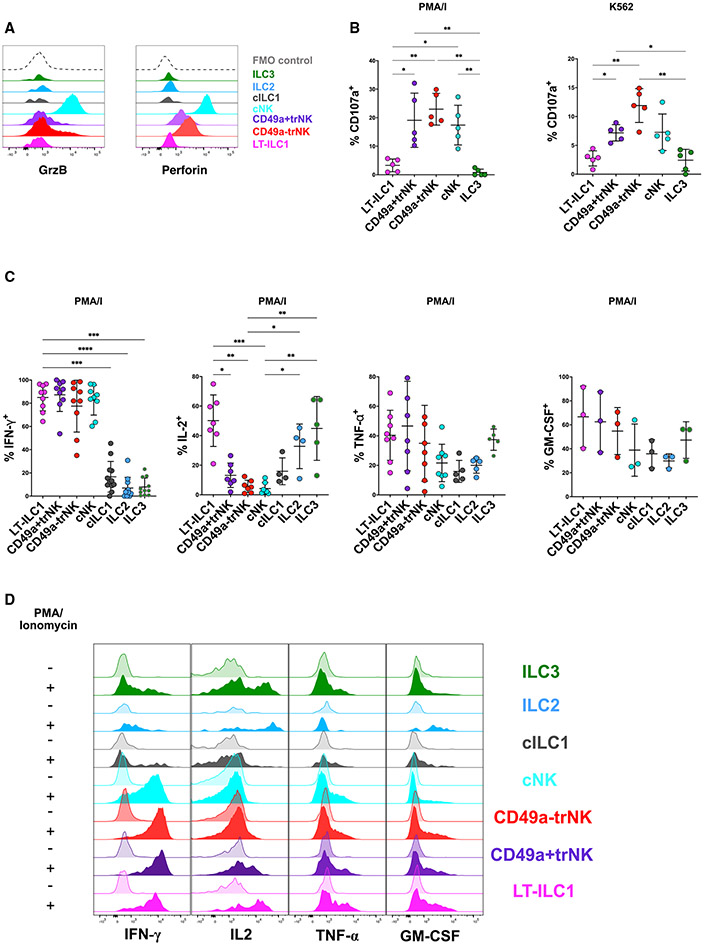
Figure 3. Liver-type ILC1s were non-cytolytic but produced IFN-γ, TNF-α, IL-2, and GM-CSF.
(A) Ex vivo intracellular flow cytometry showing perforin and granzyme-B expression patterns of human liver ILC and NK cell subsets as defined in Figure 2. Data are representative of at least three independent experiments.
(B) CD107a degranulation assay of the indicated populations following 5 h stimulation by either phorbol myristate acetate (PMA) and ionomycin or K562 target cells. All experiments were performed with healthy livers (n = 5).
(C) Analysis of cytokine production by NK cell and ILC populations from livers. For each cytokine, graphs depict intracellular flow cytometry analysis of hepatic lymphocytes following 5 h stimulation by PMA and ionomycin (IFN-γ, n ≥ 11, upper left panel; IL-2, n ≥ 4, upper right panel; TNF-α, n ≥ 5, lower left panel; GM-CSF, n ≥ 3, lower right panel).
(D) Representative histograms showing intracellular cytokine staining of the indicated hepatic ILC and NK cell subsets either unstimulated (control, semi-transparent histograms) or following 5 h stimulation with PMA and ionomycin (P/I, filled histograms).
*p < 0.05, **p < 0.01, ***p < 0.001, ****p < 0.0001, error bars represent SEM. See Figure S3.

