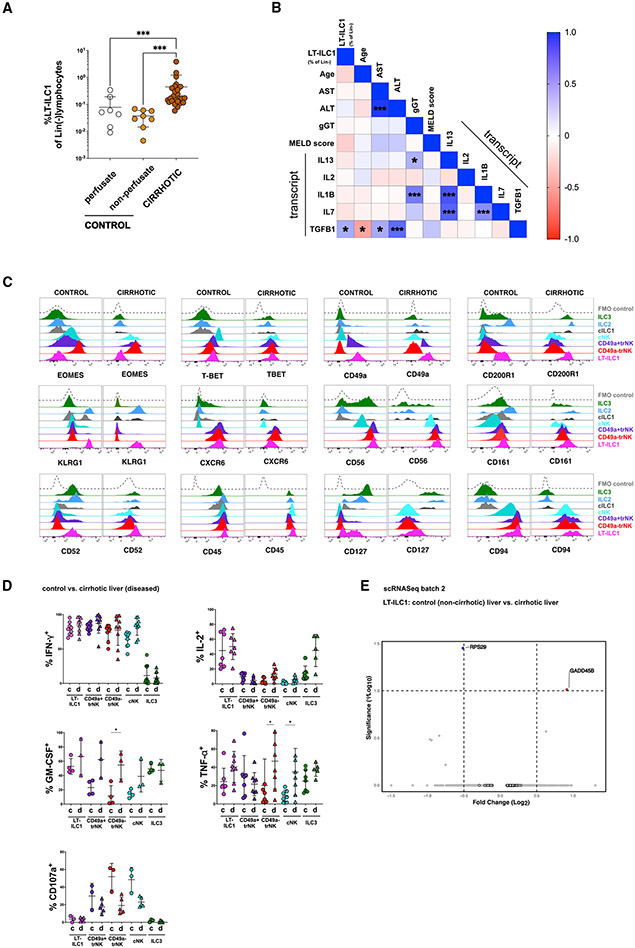
Figure 4. Liver-type ILC1s are increased in cirrhotic liver tissues.
(A) Comparison of LT-ILC1 (Lin−CD45+CD94+NKp80−CD200R1+CD49a+) frequencies calculated as percentages among total Lin− lymphocytes between control livers (perfusate n = 7), control livers (non-perfusate; n = 8), and cirrhotic livers (n = 29) (patient characteristics shown in Table S2).
(B) Correlation matrix estimated for LT-ILC1s (percent of Lin−), age, AST, ALT, gamma-GT, total bilirubin, MELD score (Model of End Stage Liver Disease), IFNG (mRNA), IL13 (mRNA), IL1B (mRNA), IL2 (mRNA), IL7 (mRNA), and TGFB1 (mRNA). LT-ILC1 frequencies were obtained from 25 cirrhotic livers. Spearman correlation coefficients (R) are given as color code. Statistically significant correlations are indicated with *p < 0.05, **p < 0.01, ***p < 0.001.
(C) Representative expression of the indicated markers by human LT-ILC1 (pink), cNK cells (turquoise), CD49a+trNK cells (violet), CD49a−trNK cells (red), cILC1s (gray), ILC2s (blue), and ILC3s (green), comparing populations derived from healthy and cirrhotic livers. Data are representative of at least three independent experiments.
(D) Comparison of IFN-γ production (healthy, n ≥ 7; cirrhotic, n ≥ 9), IL-2 production (healthy, n = 4; cirrhotic, n ≥ 4), CD107a degranulation (healthy, n = 3; cirrhotic, n = 5), TNF-α production (healthy, n ≥ 7; cirrhotic, n ≥ 5), and GM-CSF production (healthy, n ≥ 4; cirrhotic, n ≥ 3) between healthy and cirrhotic livers related to LT-ILC1 (pink), cNK cells (turquoise), CD49a+trNK cells (violet), CD49a−trNK cells (red), and ILC3s (green), from healthy and cirrhotic livers following 5 h PMA and ionomycin stimulation and measured by intracellular flow cytometry.
(E) Volcano plot showing DEG differences based on scRNA-seq data between LT-ILC1s comparing “control versus cirrhotic liver tissues” from batch 2.
*p < 0.05, ***p < 0.001, error bars represent SEM. See Figure S4.

