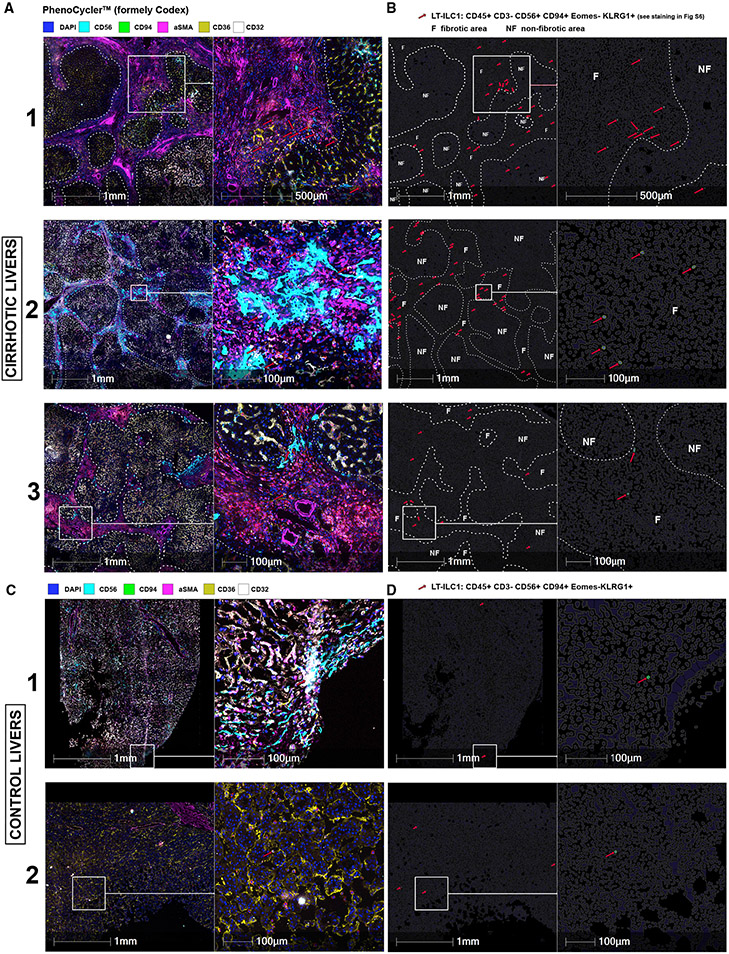
Figure 5. LT-ILC1 cells accumulate in fibrotic area of the human liver.
Representative images of three cirrhotic (A) and two control livers (C) generated with PhenoCycler (formerly Codex) with a selection of markers such as CD56, CD94, aSMA, CD36, and CD32, as well as DAPI for nucleus staining (A, C). An overview (left) and magnification (right) are shown side by side with scale bar and indicated diameters. Fibrotic regions were recognized and delineated with a white dashed line using aSMA-staining. The red arrows indicate LT-ILC1 cells automatically detected by the HALO image analysis software by CD45+CD3−CD56+CD94+EOMES−KLRG1+ definition (see staining in Figure S5). Images in (B) and (D) were artificially generated as cell contours using HALO image analysis and correspond to the respective section from (A) and (C). Only the identified LT-ILC1 cells were highlighted for enhanced visibility (surface is green, nucleus is blue and indicated with red arrows) with visualization of the non-fibrotic (NF) and fibrotic (F) regions.

