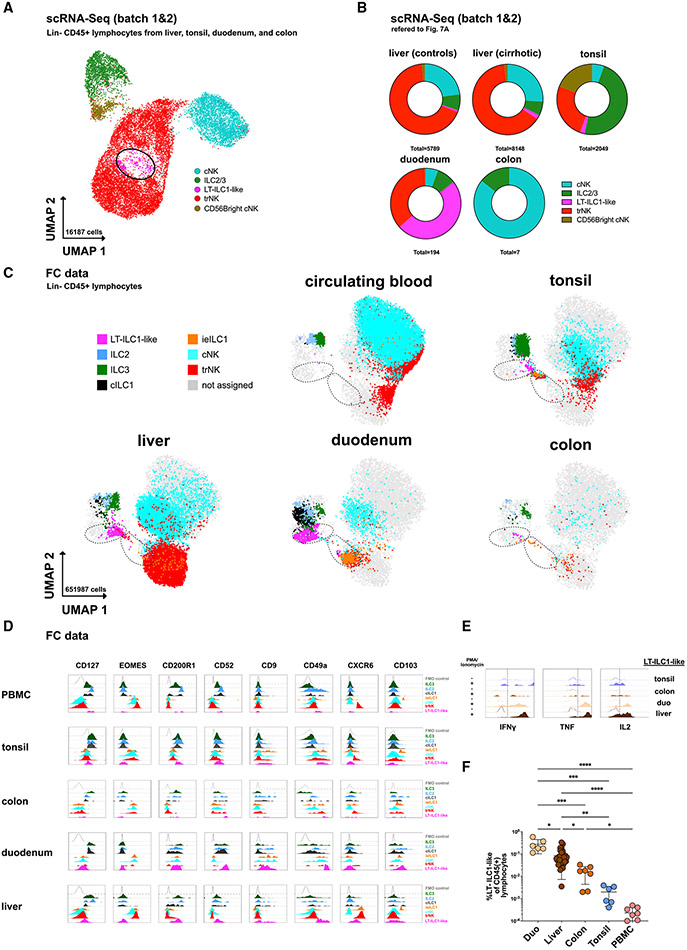
Figure 7. Population of cells with liver-type ILC1-associated features are identified in other tissues.
(A) scRNA-seq analysis of Lin−CD45+ lymphocytes from control livers, cirrhotic livers, tonsils, duodenum, and colon from batches 1 and 2 with assignment of cell populations trNK, cNK, ILC3/ILC2, and LT-ILC1-like cells based on a match to known gene signatures and illustrated in UMAP with 16,187 cells (assignment in Figures S7A-S7C; G). LT-ILC1-like cells are marked with a black circle.
(B) scRNA-seq analysis showing the relative proportion of cNK, ILC2/ILC3, LT-ILC1-like, and trNK populations among control liver, cirrhotic liver, tonsil, duodenum, and colon tissues (n = 3 per compartment).
(C) Dot plot showing CD45+Lin− lymphocytes with the relative distribution of the indicated populations identified in Figures 1B and S7I among peripheral blood, tonsil, liver, duodenum, and colon tissues of each three subjects displayed in UMAP (based on markers indicated in Table S3). The left black dashed circle includes LT-ILC1-like cells, and the right dashed circle includes intraepithelial ILC1 cells.
(D) Representative histograms showing the relative expression of the indicated markers among the populations identified in Figures 1B and S7I in peripheral blood, tonsil, colon, and duodenum tissues in addition to control liver.
(E) Representative histogram of intracellular flow cytometry analysis of IFN-γ, TNF-α, and IL-2 produced by LT-ILC1-like cells (same gating as for Figures 1C and 1D) following ex vivo stimulation for 5 h with PMA and ionomycin. Unstimulated cells were set as controls.
(F) Relative frequency of LT-ILC1-like cells calculated as the percentage of total CD45+ lymphocytes in the duodenum (n = 6), liver (n = 29), colon (n = 7), tonsil (n = 6), and peripheral blood (n = 8). *p < 0.05, **p < 0.01, ***p < 0.001, ****p < 0.0001, error bars represent SEM. See Figure S7.

