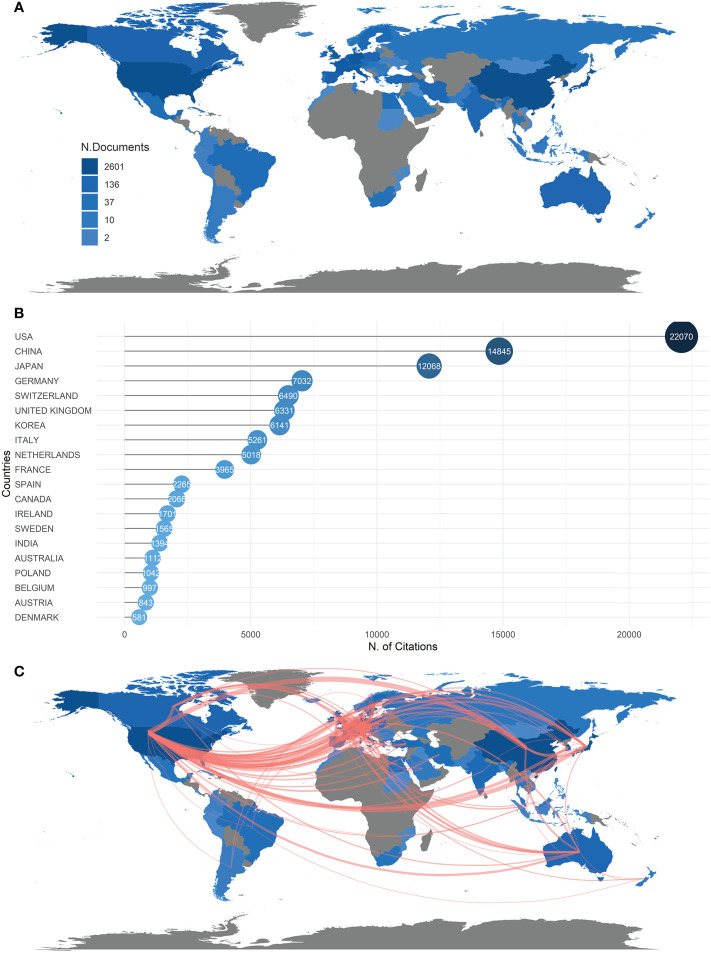
Figure 2.
(A) Countries/Regions distribution of publications of RD and fibroblasts. The number of articles published by each country/region in the 21st century is indicated by the shade of color on the map. (B) Top 20 countries being cited the most in the 21st century. (C) The density of the red line represents the frequency of the collaboration work between countries.

