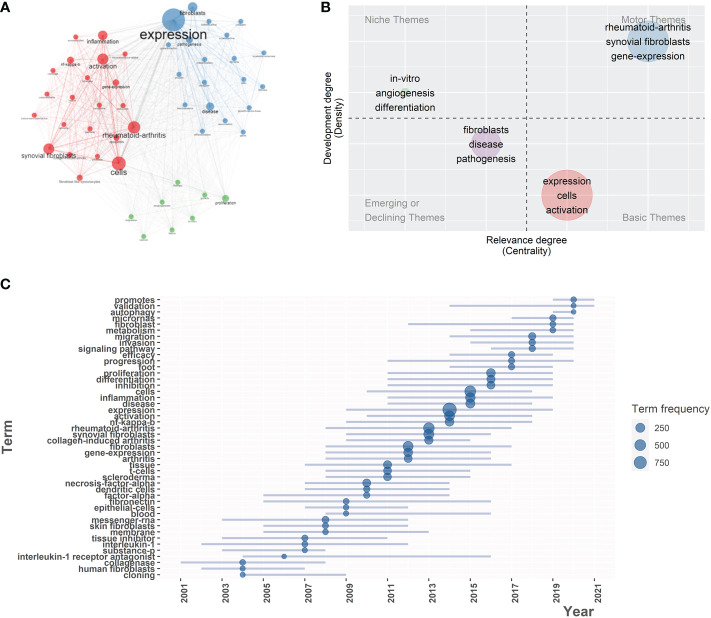
Figure 5.
(A) Co-occurrence network of 50 keywords. Circle size is based on the number of occurrences. Three colors are used to indicate clusters: Blue (cluster1), Red (cluster2), Green (cluster3). (B) Thematic map. All articles were grouped into four clusters, each cluster corresponding to the four themes of the map according to density and centrality. Three keywords with the highest occurrence rate were displayed in each cluster. (C) Trend topics in the 21st century, the graph demonstrates the most frequent keywords over time. The blue dots locate at the year with the highest frequency of occurrences of this keyword.

