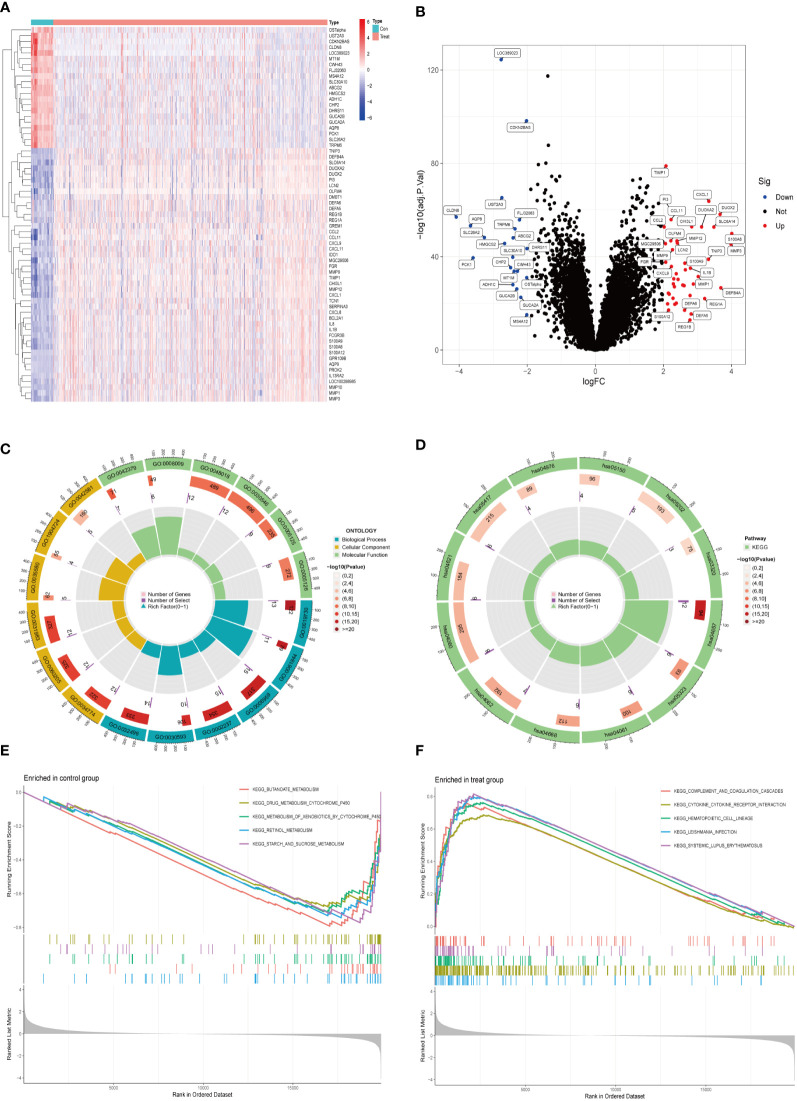
Figure 1.
Identification of DEGs between UC and control samples. (A) The expression of 65 DEGs was visualized by heatmap. Red for upper regulation, blue for lower regulation (B) Volcano map of DEGs in UC compared to healthy controls. The significantly upregulated DEGs (log2FC>2, adj.P<0.05) were labeled in red, and the significantly downregulated DEGs (log2FC<2, adj.P<0.05) were labeled in blue. (C, D) GO and KEGG enrichment analyses of DEGs. The outermost circle was the GO number, the second circle represented the number of genes on the GO, and the third circle represents the number of genes enriched on the GO. The color represented the p-value of significant enrichment, the redder the color, the more significant the enrichment. (E, F) Results of GSEA pathway analysis in UC and healthy control samples.

