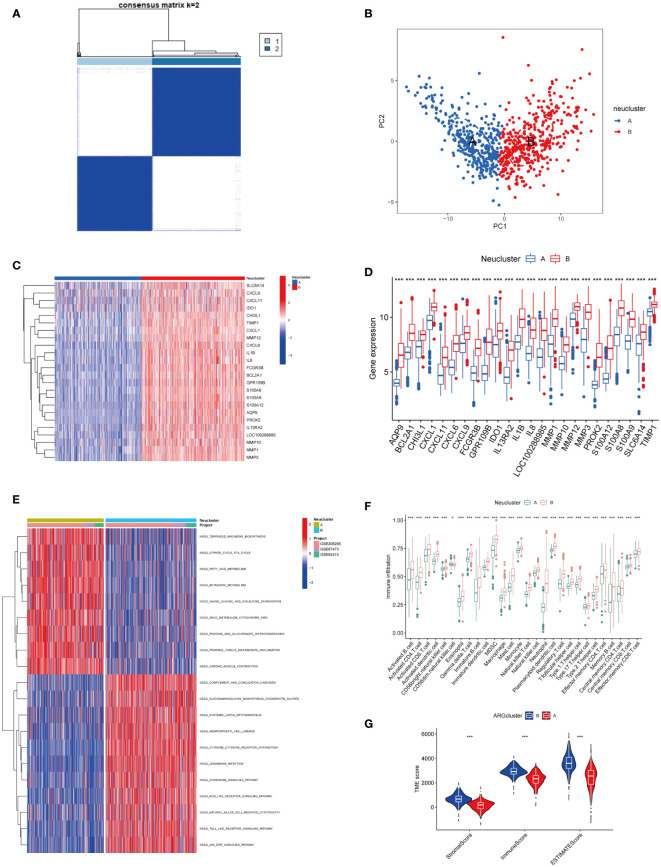
Figure 3.
Exploration of neutrophil-associated subtypes and biological features. (A) Consensus matrix heatmap defining two clusters (k = 2) and their correlation area. (B) PCA analysis showed significant differences in transcriptomes between the two subtypes. (C, D) Heatmap and boxplot of the expression of 24 NADEGs in different clusters. Red for upper regulation, blue for lower regulation. (E) GSVA of biological pathways between two distinct subtypes, in which red represented activated and blue inhibited pathways. (F) The ssGESA results indicated the abundance of 28 infiltrating immune cells in different subtypes. The asterisks represented the statistical P-value (*P < 0.05; **P < 0.01; ***P < 0.001). (G) Correlations between the two subtypes and TME score. The asterisks represented the statistical P-value (*P < 0.05; **P < 0.01; ***P < 0.001).

