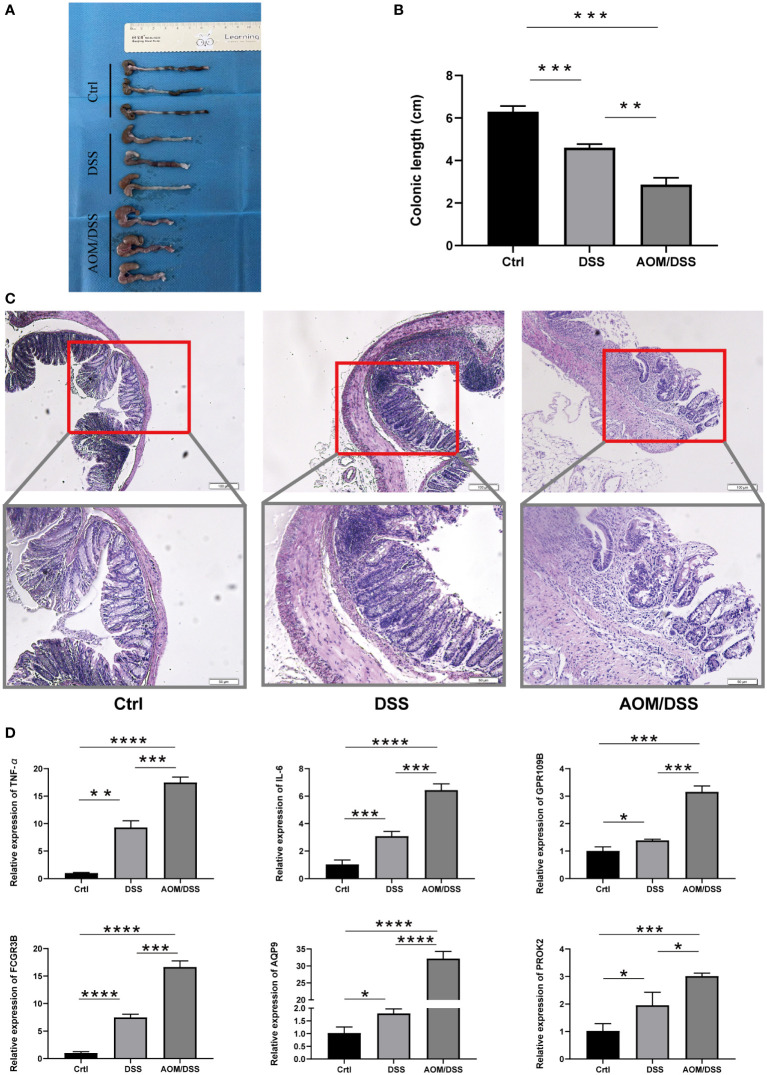
Figure 6.
Expression of five markers in the mouse model. (A, B) Colon length of different groups of mice. (C) Representative H&E staining of different groups of (D) colon. (C) RT-PCR analysis of differential gene expression results in the Crtl, DSS and AOM/DSS groups. The asterisks represented the statistical p-value (*P < 0.05, **P < 0.01, ***P < 0.001, and ****P < 0.0001).

