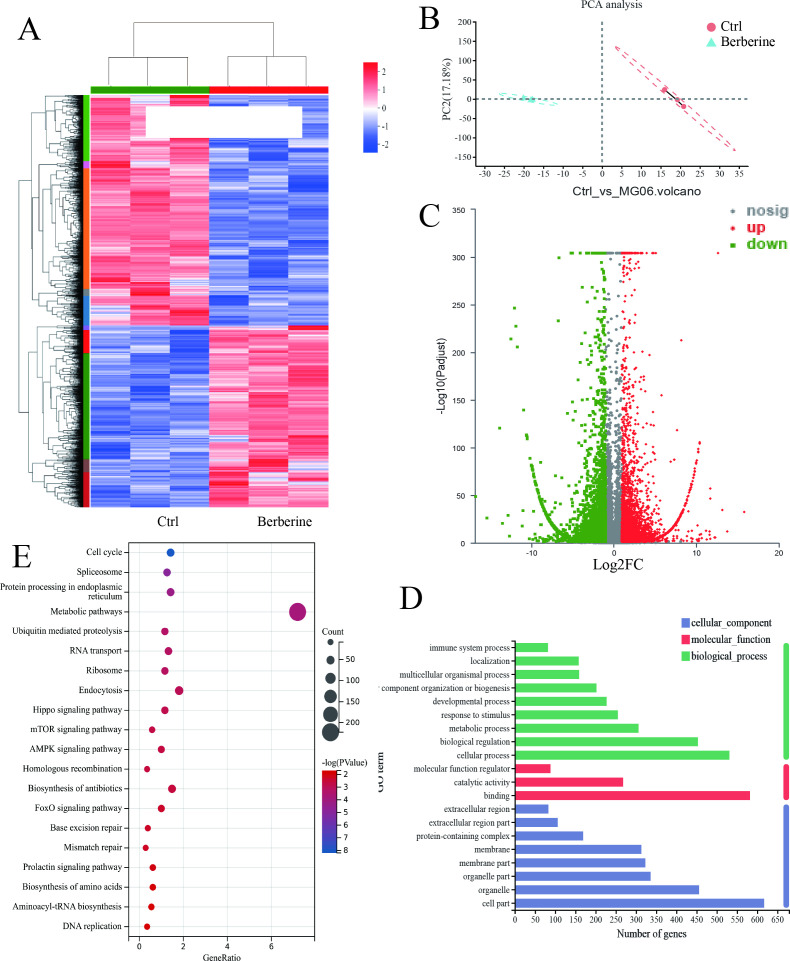
Fig. 3.
a) Clustering heat map of differential transcripts. b) The principal component analysis (PCA). c) Volcanic map of berberine-regulated transcripts. d) Gene ontology (GO) bar chart of differential transcripts. e) Kyoto Encyclopedia of Genes and Genomes (KEGG) pathway bubble diagram. AMPK, AMP-activated protein kinase; FOXO, forkhead box O.

