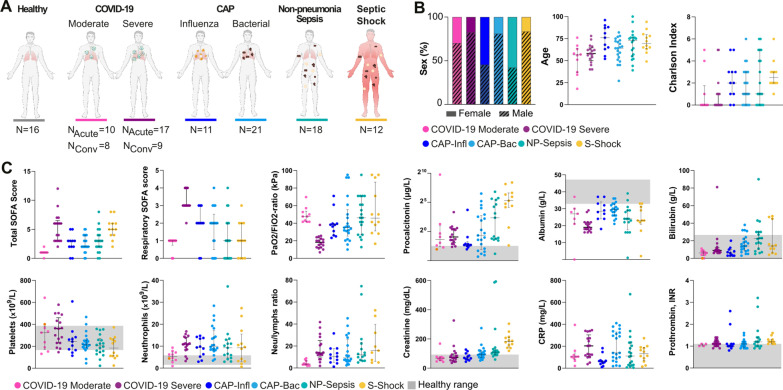
Fig. 1.
Baseline characteristics of the study cohorts. A Number of healthy individuals and patients per group. B Distribution of sex, age, and Charlson comorbidity index per group. Colors depict patient subgroups, as indicated. C Clinical biomarkers of disease severity at sampling. The grey shadowed areas represent the reference values of the corresponding biomarkers. Significant differences between groups in Additional file 2: Tables S1 and S2. CAP-Infl CAP caused by influenza virus, CAP-Bac CAP caused by bacteria, NP-Sepsis Non-pneumonia sepsis, S. Shock Septic shock. NAcute Number of samples in acute COVID-19. NConv Number of samples during convalescence. NLR Neutrophil-to-lymphocyte ratio

