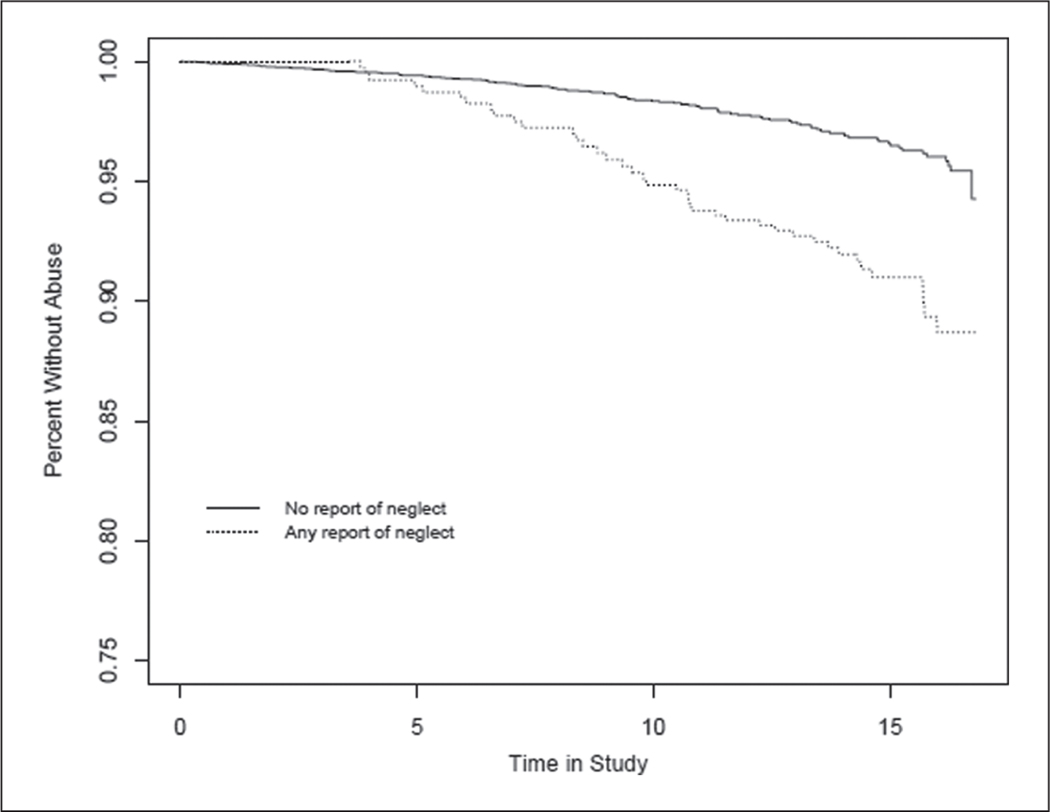
Figure 1.
Kaplan–Meier survival curve for differences between those with and without elder self-neglect and subsequent elder abuse
X-axis: Years in the CHAP study
Y-axis: Percentage of CHAP participants without elder abuse
Note: Figure demonstrates that those with elder self-neglect compared to those without elder self-neglect are at greater risk to experience elder abuse in the study period.

