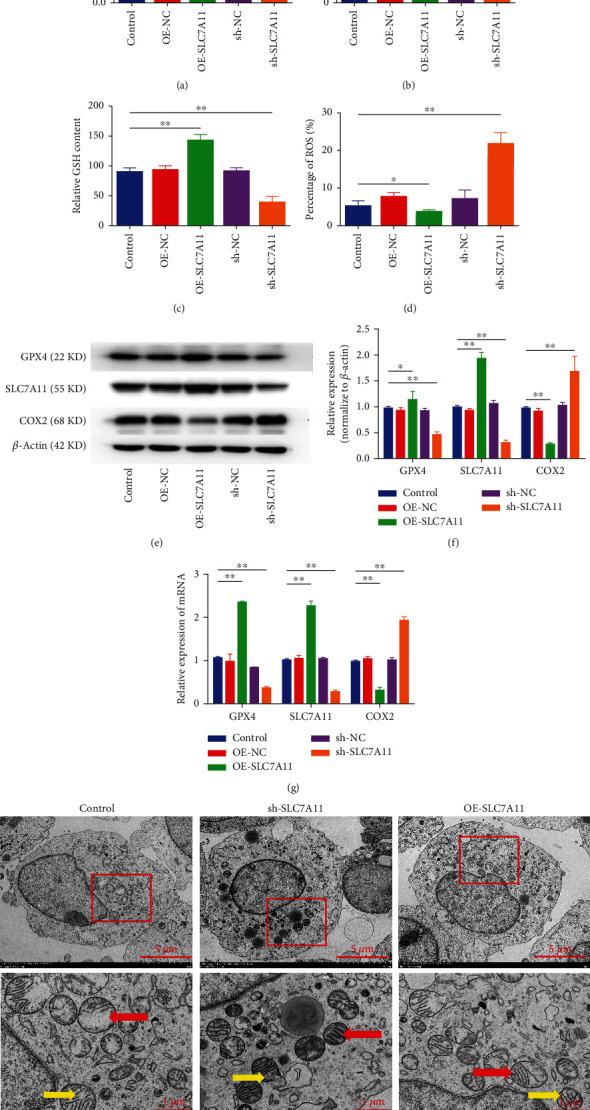
Figure 5.

SLC7A11 overexpression improved the proliferation and inhibited ferroptosis of CCSCs. (a) Proliferative ability of CCSCs transfected with sh-SLC7A11 or OE-SLC7A11 as assessed using the CCK-8 assay. (b) Levels of Cys in CCSCs transfected with sh-SLC7A11 or OE-SLC7A11. (c) Levels of GSH in CCSCs transfected with sh-SLC7A11 or OE-SLC7A11. (d) Cellular levels of ROS in CCSCs transfected with sh-SLC7A11 or OE-SLC7A11, as detected using flow cytometry. Results are expressed as percentages; bar graph summarises the quantitative data as mean ± SD of values from three independent experiments. (e, f) Western blotting and quantitative analysis of GPX4, SLC7A11, and COX2 in CCSCs transfected with sh-SLC7A11 or OE-SLC7A11. (g) qRT-PCR analysis of GPX4, SLC7A11, and COX2 in CCSCs transfected with sh-SLC7A11 or OE-SLC7A11. (h) Transmission electron microscopy of CCSCs transfected with sh-SLC7A11 or OE-SLC7A11. The images below are enlarged version of the red area. The red arrows indicate thickening of the mitochondrial membrane and narrowing of the mitochondria. The yellow arrows indicate the mitochondrial crista. Scale bars of the picture above: 5 μm; scale bars of the picture below: 1 μm. Data are presented as mean ± SD; ∗P < 0.05 and ∗∗P < 0.01.
