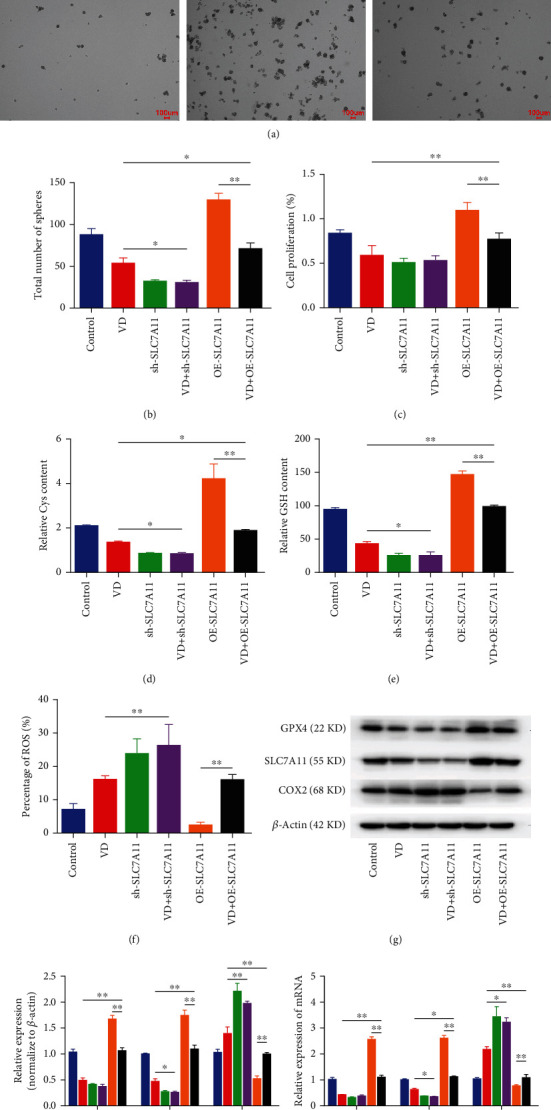
Figure 6.

SLC7A11 overexpression rescued VD-induced ferroptosis in CCSCs in vitro. (a) Formation of spheroids in CCSCs of different groups. Scale bars: 100 μm. (b) Number of tumour spheroids of CCSCs in different groups. (c) Proliferation ability of CCSCs in different groups, as assessed using the CCK-8 assay. (d) Levels of Cys in CCSCs of different groups. (e) Levels of GSH in CCSCs of different groups. (f) Cellular levels of ROS in CCSCs, as detected using flow cytometry. Results were expressed as percentages; bar graph summarises the quantitative data as mean ± SD of values from three independent experiments. (g, h) Western blotting and quantitative analysis of GPX4, SLC7A11, and COX2 in CCSCs of different groups. (i) qRT-PCR analysis of GPX4, SLC7A11, and COX2 in CCSCs of different groups. Data are presented as mean ± SD; ∗P < 0.05 and ∗∗P < 0.01.
