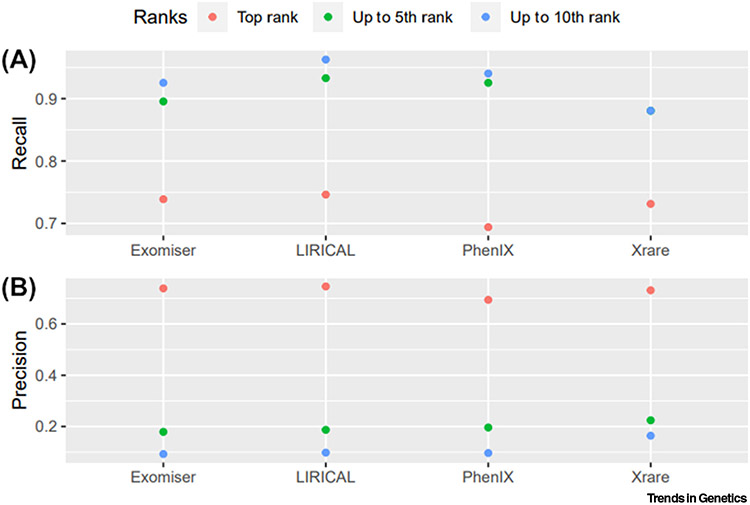
Figure 3. Scatter plots of diagnostic measurements for the software performance of the four successfully tested phenotype-aware variant prioritisation (VP) software tools.
(A) Recall (true positive rate) and (B) precision were calculated from confusion matrices for the correctly diagnosed variants matched in the first rank, up to the fifth rank, and up to the tenth rank by each of the tested VP software tools. Recall (true positive rate) = true positives (TP)/actual positives; precision = TP/predicted positives. For Xrare, the recall estimate for the ‘up to the fifth rank’ analysis is equal to the recall estimate for the ‘up to the tenth rank’ analysis (i.e., 0.88).

