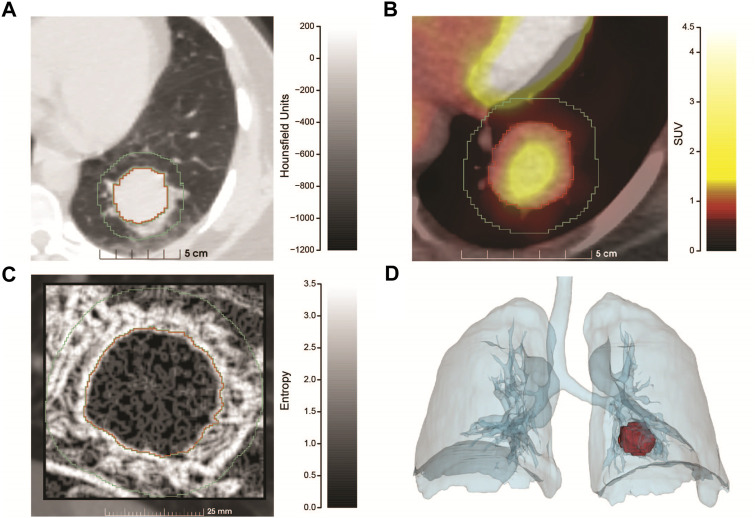
FIGURE 1.
Radiomics analysis of the PSP tumor. (A) Pre-operative chest CT scan with contrast utilizing lung window settings. The image is an axial projection that has been zoomed to show an optimal view of the tumor that resides in the left lower lung along with a small region of the mediastinum. Tumor segmentation is outlined in red, with the 1 cm border surrounding the tumor proper, outlined in green. The x-axis contains a size scale (cm) and y-axis Hounsfield Units (HU) scale (−1200–200) with shading. (B) Combined PET/CT of the tumor (zoomed) at diagnosis. The tumor had a SUV max of 2.2 and SUV mean of 1.3, the x-axis contains a size scale (cm) and y-axis contains the SUV scale (0–4.5) with color coding. (C) Feature map showing the entropy of the tumor and 1 cm surrounding region, generated from a sagittal slice of the CT at presentation. The tumor is significantly more homogenous than the surrounding region. The x-axis contains a size scale (mm) and y-axis contains an entropy scale (0–3.5) with shading. (D) Volume rendering showing the size and position of the tumor at diagnosis. Produced using segmentations of the lungs and tumor from the PET/CT series.

