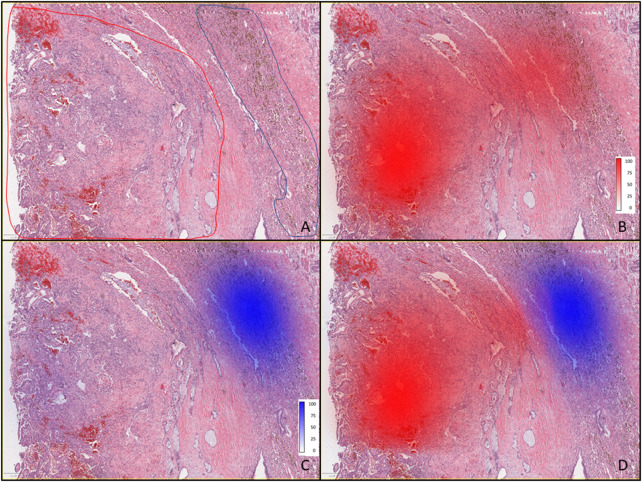
FIGURE 2.
Pathomics analysis of the PSP tumor. (A) Low-power (4×) photomicrograph showing areas containing tumor (outlined red) and hemosiderin-laden macrophages (outlined blue) as annotated by the pathologist. (B) Tumor with red color density maps showing the number of cells per mm2 as identified by the classifier, and shown as percentages (0–100), where the 100% scale value corresponds to 1660 cells per mm2, along with intense red coloring. (C) Tumor tissue with blue color density maps showing hemosiderin-laden macrophages where the most intense blue color and scale value of 100% corresponds to 349 cells per mm2 (as identified by the classifier). (D) Overlaid density maps for both cell types (same classifier results and color intensity scales as in (B,C).

