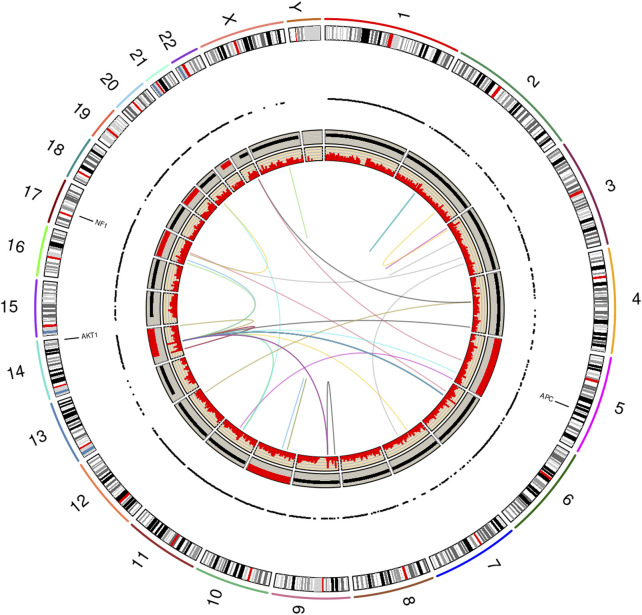
FIGURE 3.
RCircos plot produced by the NGS Post-pipeline Accuracy and Reproducibility System (NPARS). This figure summarizes and integrates seven genomics methods into one graphical plot. From the outermost ring inward: (i) human chromosomal ideogram, (ii) DNA panel mutations (tumor vs. germline), (iii) RNA expressed mutations from the full transcriptome, each dot represents a RNA expressed mutation (depth greater than or equal 10), (iv) whole genome DNA copy number variations (tumor vs. germline) with red representing a copy number greater than 2, copy number equal to 2 by black coloring, and a copy number smaller than 2 by blue, (v) RNA gene expression (TPM) and, (vi) RNA gene fusions.

