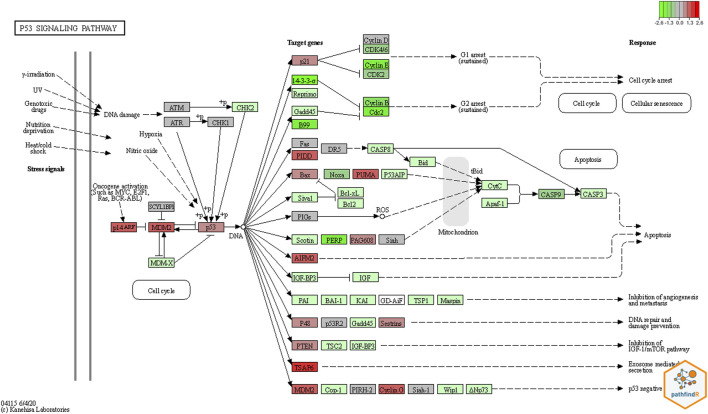
FIGURE 4.
Pathway Result by pathfindR. The colored plot was generated based on KEGG pathway diagrams through pathfindR. Red colors represent upregulated genes, and green colors the down regulated genes. In this plot for the TP53 pathway, MDM2 which is the principal negative regulator of the pathway, was significantly upregulated.

