FIGURE 2.

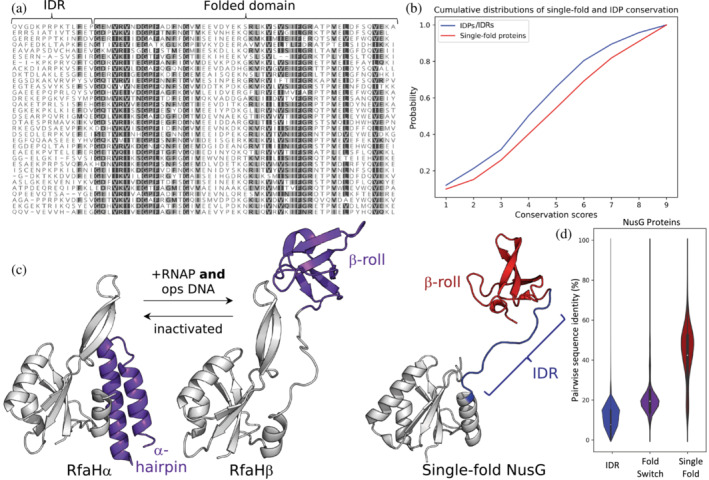
Sequence conservation patterns can differ among single‐fold, fold‐switching, and intrinsically disordered proteins. (a) The region of a NusG sequence alignment depicting its linker, an intrinsically disordered region (IDR), shows little sequence conservation while its single‐fold C‐terminal domain (folded domain) shows more. Conserved residues with dark gray/light gray backgrounds can be substituted with BLOSUM62 scores of 0 or higher and constitute 80%–99%/60%–80% of the amino acids in each column. Less conserved residues have white backgrounds. Alignment was generated by searching the Uniref30 database from February 2022 with the sequence of PDB 2JVV_1 using the HHblits online alignment tool (Steinegger et al., 2019; https://toolkit.tuebingen.mpg.de/tools/hhblits); alignment generated with Geneious Prime. (b) Consistent with the sequence alignment in (a), IDPs evolve more rapidly than single‐fold proteins. Cumulative distributions of conservation scores, calculated with Rate4Site in Chakravarty & Porter (2022), indicate that a sample of 100 randomly chosen IDPs evolves more quickly than a set of single‐fold proteins. Larger scores indicate stronger conservation and slower evolutionary rates. (c) RfaH, a member of the universally conserved NusG transcription factor family, has a C‐terminal domain (purple) that switches between completely α‐helical (PDB ID: 2OUG, Chain C) and β‐sheet folds (PDB ID: 6C6S, Chain D) in response to binding RNA polymerase and a specific DNA sequence known as ops. In contrast, the C‐terminal domains (CTDs) of all other NusGs with solved structures maintain the β‐sheet fold only (red). Their intrinsically disordered linker (blue) corresponds to the IDR region in (a); note that it lacks crystal density in the structure of RfaHα. N‐terminal domains of NusG and RfaH are colored gray. (d). Among NusG proteins, conformational heterogeneity and pairwise sequence identity appear inversely related. Median values (white dots) within the distributions of pairwise sequence identities between NusG IDRs (blue), fold‐switching CTDs (purple), and single‐fold CTDs (red) increase. Interquartile ranges are depicted within the distributions as bold black lines. Plots in (b) and (c) generated with matplotlib (Hunter, 2007) and seaborn (Waskom, 2021).
