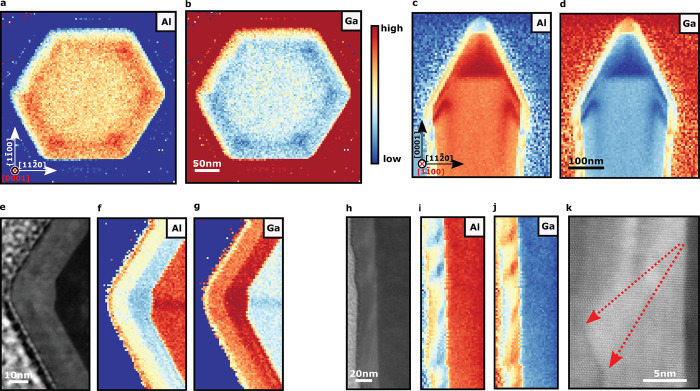
Figure 2.
TEM–EDS elemental composition maps. (a) Low-magnification map of the first section looking along the c direction. The Al X-ray peak intensity variation within the core reveals increased Al incorporation on the a axes. (b) Ga K- and L-line X-ray peak intensities within the core showing the inverse of the Al map as expected. (c and d) Low-magnification map of the second section looking through the m direction. The formation of the “broadhead” can be seen here. (e) Higher magnification high-angle annular dark-field (HAADF) image focusing at one of the corners of the hexagonal structure. Z contrast in the images reveals the location of the core, quantum well, and p-AlGaN capping layer. The formation of a distinct a plane at the edge of the core is clear. (f) Al X-ray peak intensity showing both the increased Al incorporation when moving from the core center along the a direction and decreased Al in the quantum well on the a-plane facet. (g) Ga X-ray peak intensity with the core again showing the inverse of the Al map as expected. (h, i, and j) HAADF and Al and Ga X-ray peak intensities over the same area, showing alloy fluctuations along the quantum well. The Ga-rich composition develops in a semipolar direction from the a plane. (k) Higher magnification HAADF TEM image focusing along one of the a planes. Here, we can see the exacerbation of surface roughness as growth progresses outward.

