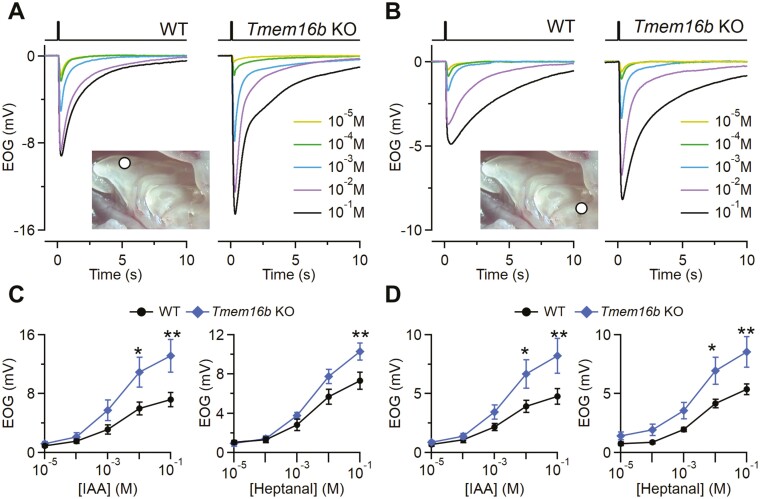
Figure 2.
Odorant responses in WT and Tmem16b KO mice. Representative EOG recordings from WT or Tmem16b KO mice. The responses were evoked by 100 ms stimulation with isoamyl acetate (IAA) vapor of increasing concentrations ranging from 10-5 to 10-1 M as indicated. EOG recordings were obtained from anterior (A) or posterior (B) portions of OEs as shown in the inset. Dose–response relationships of average peak EOG amplitudes from WT or Tmem16b KO mice to IAA or heptanal vapor obtained from anterior (C) or posterior (D) portions of OE (n = 9–12; **P < 0.01 *P < 0.05 t-test with Bonferroni correction after mixed two way ANOVA). Error bars represent sem.

