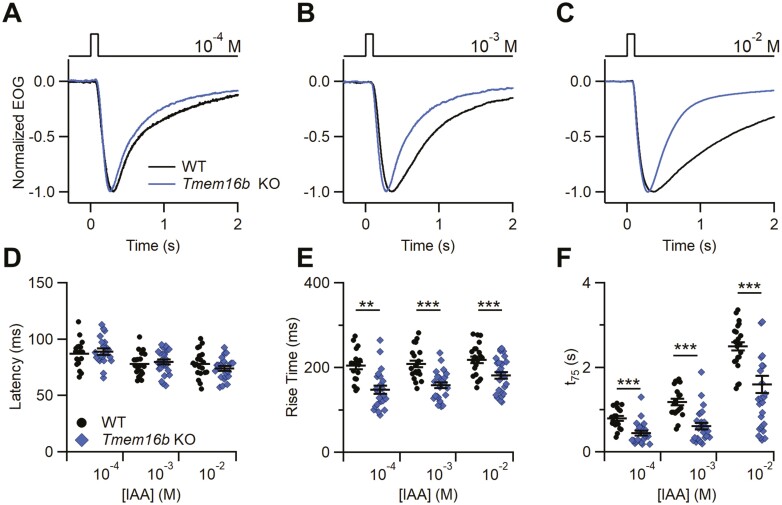
Figure 3.
Kinetics of the odorant response in WT and Tmem16b KO mice. (A–C) Representative normalized EOG recordings from WT or Tmem16b KO mice. The responses were evoked by 100 ms stimulation of vapors of the indicated IAA solution concentration. Scatter dot plot with average ± sem showing the values of latency (D), rise time (E) and decay time (t75) (F) in WT or Tmem16b KO mice at each odorant concentration (n = 17–21; **P < 0.01 ***P < 0.01 Student’s t test).

