Figure 4.
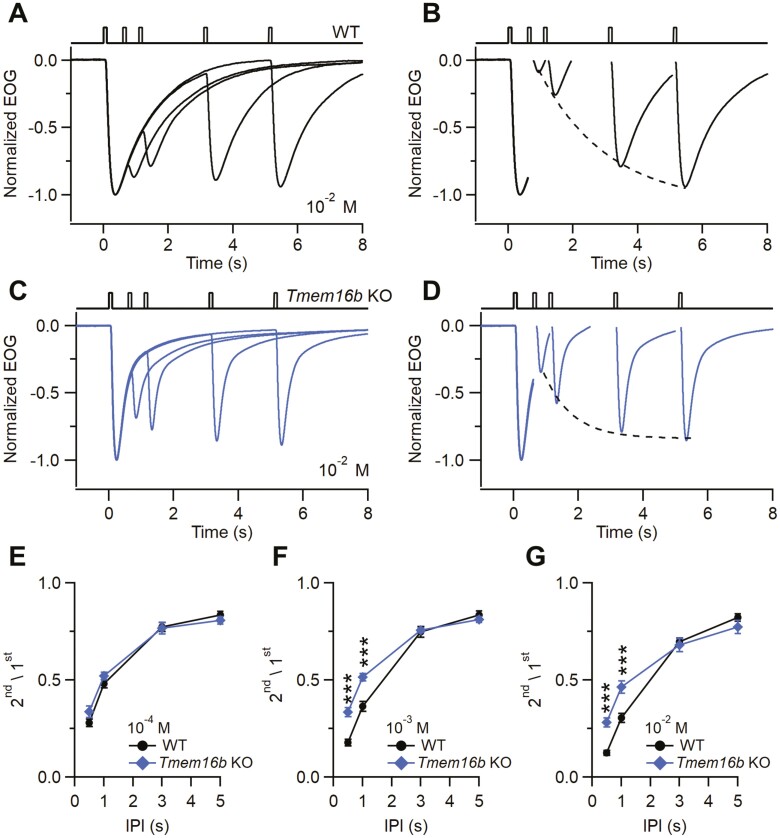
Paired pulse odorant responses in WT and Tmem16b KO mice. Representative normalized EOG double pulse responses from WT (A) and Tmem16b KO mice (C). OEs were stimulated with 100 ms-long pulses with different interpulse intervals (IPI 0.5, 1, 3, 5 s) with IAA at 10–2 M concentration. (B, D) Net responses to each stimulus for the recordings are shown in (A–C). Dotted line represents the mono-exponential fit obtained with the peak responses to the second odor pulses. (E–G) Ratio of the second stimulus to the first ± sem at the indicated odorant concentration plotted versus the IPI (n = 8–10; ***P < 0.001 t-test with Bonferroni correction after mixed two-way ANOVA).

