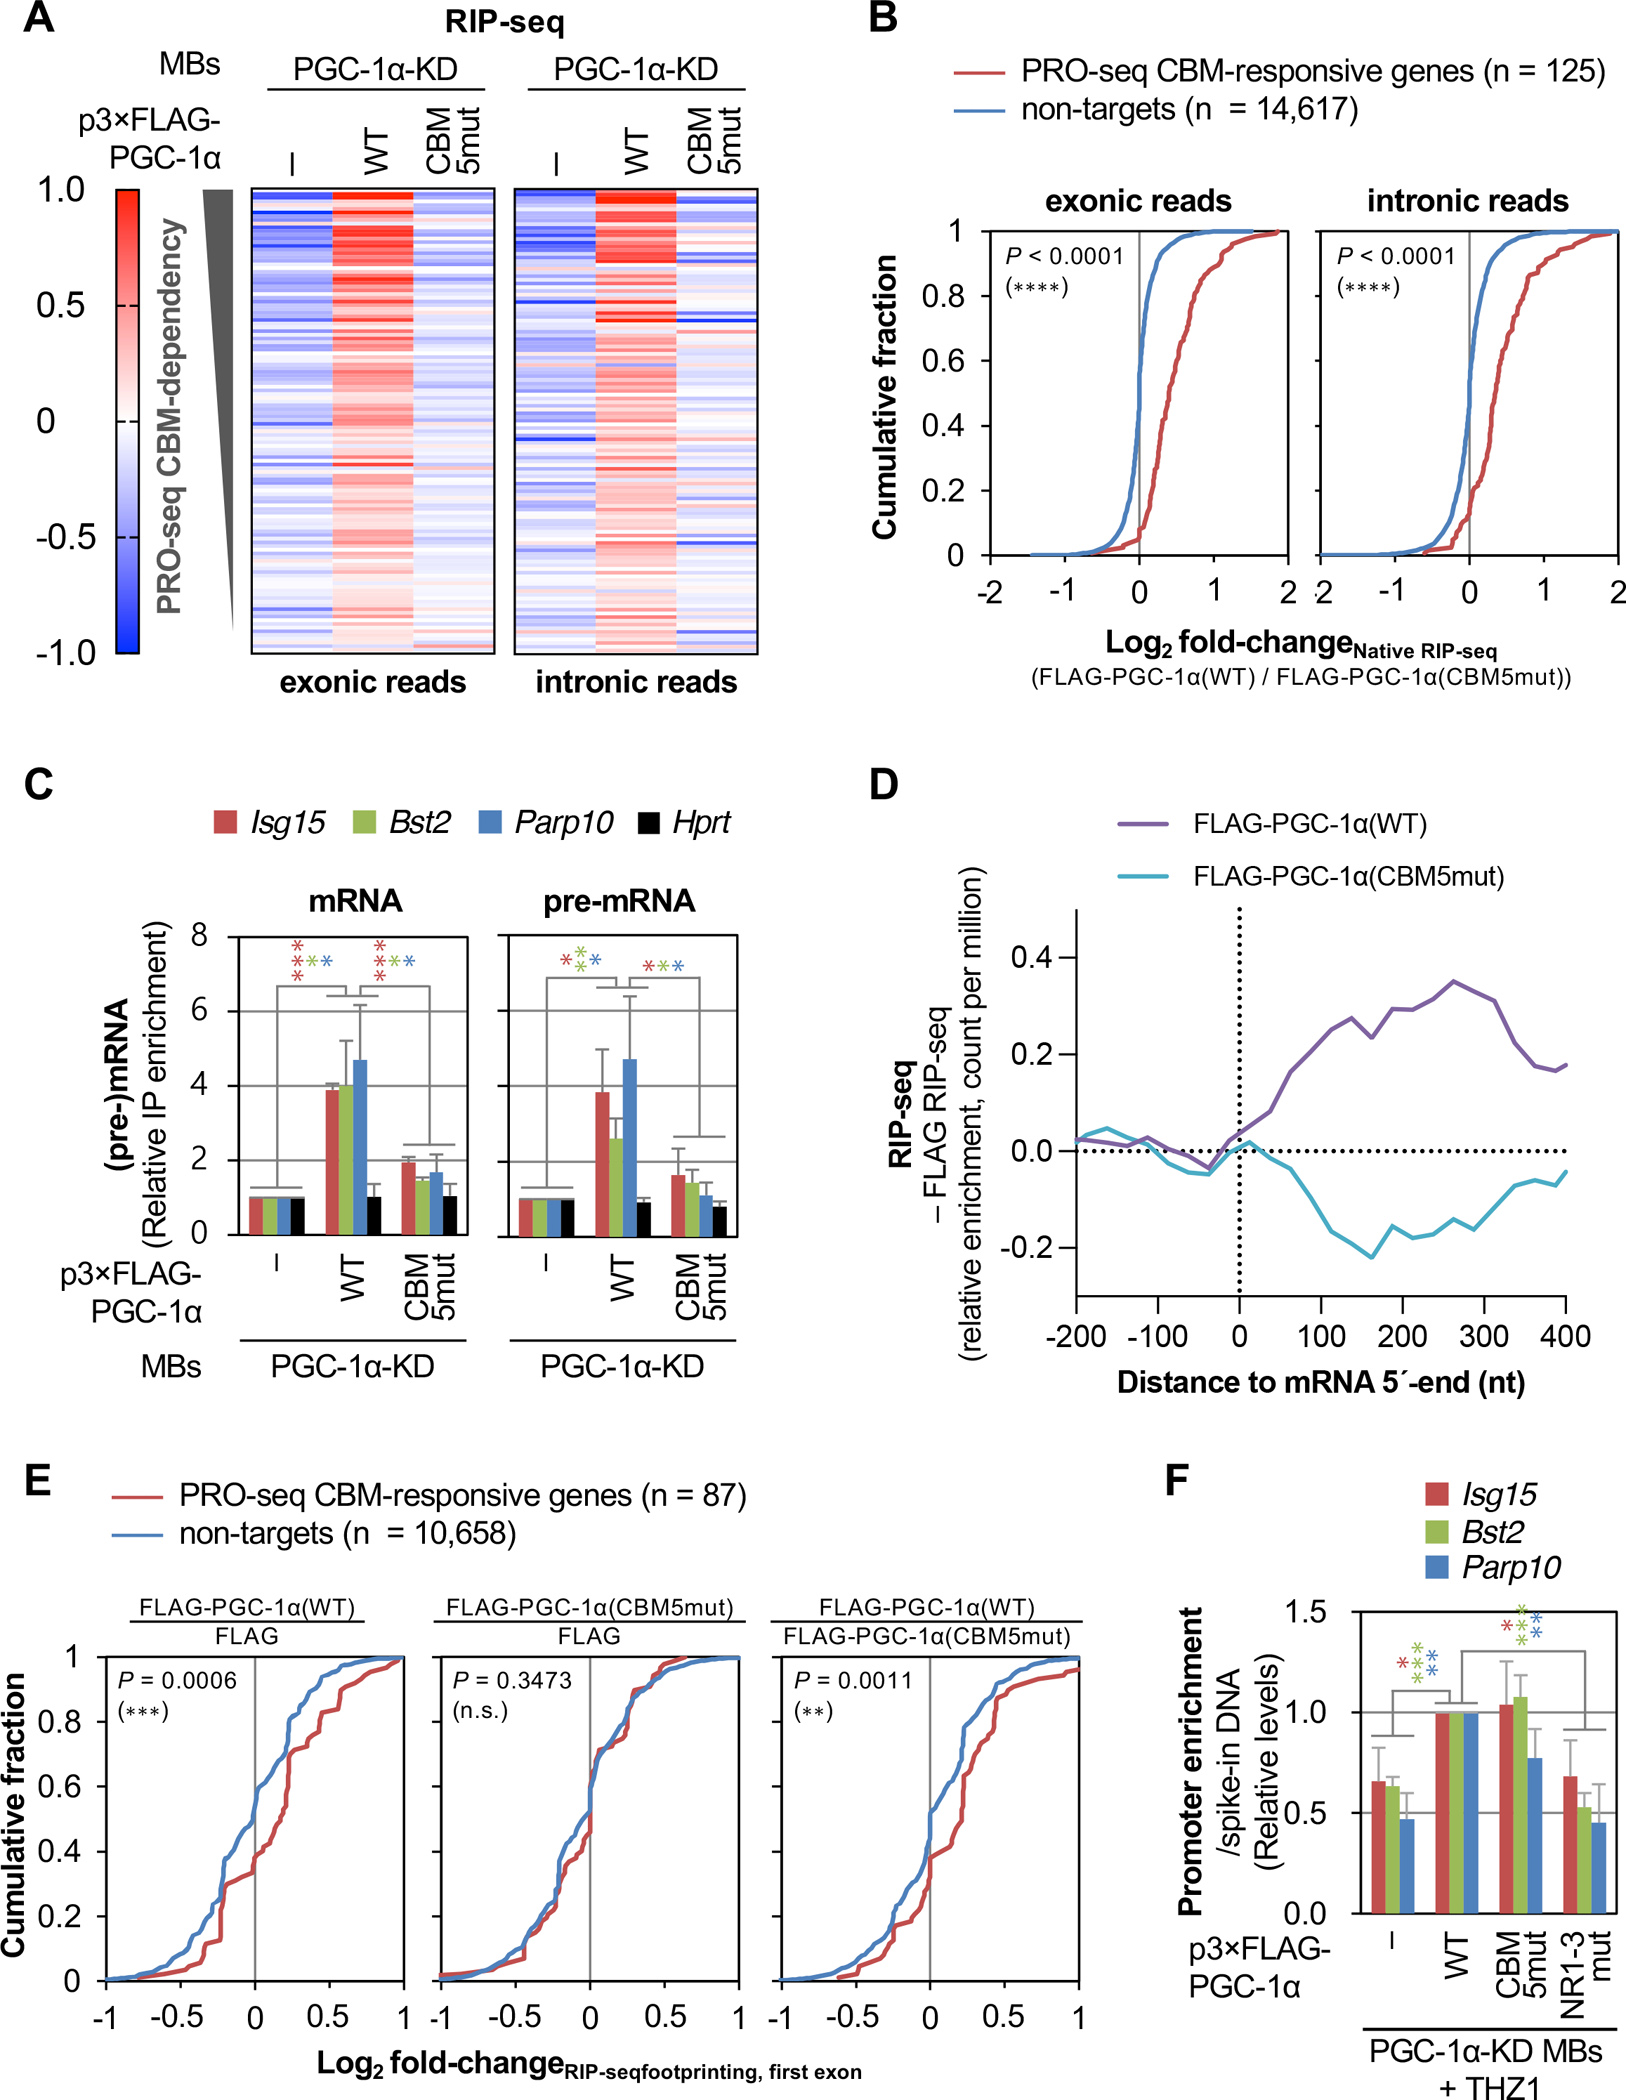
Figure 5. PGC-1α CBM and NR motifs positively regulate PPP dynamics via binding to CBP80 at the 5´ end of transcripts and to ERRα at gene promoters, respectively.

(A) Heatmap representation of raw-scaled RNA-seq log2-fold changes in anti-FLAG IPs (i.e. native RIP-seq) using lysates of the specified MBs and exonic (left) or intronic (right) Illumina reads mapped to transcripts from genes shown in Figure 4A. Results are means (n = 3 biological replicates).
(B) Differential cumulative distribution of the average (n = 3 biological replicates) relative enrichment of exonic (left) or intronic (right) Illumina reads in anti-FLAG IPs (native RIP-seq) in lysates of PGC-1α KD MBs transiently expressing FLAG-PGC-1α(WT) relative to FLAG-PGC-1α(CBM5mut). Here and in differential cumulative distributions below, P-values compare PRO-seq CBM-responsive genes (red) or non-target genes (blue) using a Kolmogorov-Smirnov test.
(C) Histogram representations of RT-qPCR quantitations of mRNA (left) and pre-mRNA (right) from three PGC-1α(CBM)-responsive genes and control gene Hprt, after anti-FLAG IP relative to before IP using lysates of the specified MBs, where values for PGC-1α-KD MBs expressing FLAG were set to 1. Here and in histograms below, results are means ± S.D. (n = 3 biological replicates), P-values compare the indicated conditions using a two-tailed unpaired Student’s t-test., P < 0.05;, P < 0.01;, P < 0.001; no asterisks, P ≥ 0.05. Asterisk color corresponds to gene color.
(D) Average distribution (n = 3 biological replicates) of the relative enrichment of Illumina reads in anti-FLAG IPs using lysates of PGC-1α-KD MBs expressing FLAG-PGC-1α(WT) or FLAG-PGC-1α(CBM5mut), relative to PGC-1α-KD MBs expressing FLAG alone, for the 5ʹ-region of transcripts from genes shown in A. Relative read counts are summed in non-overlapping 25-nucleotide bins.
(E) As B, but showing the average (n = 3 biological replicates) relative enrichment of Illumina reads mapping to first exons in RNase I-treated anti-FLAG IPs (i.e. RIP-seq footprinting) from PGC-1α KD cells transiently expressing the specified constructs. Only genes for which first-exon footprints were identified in each IP are included.
(F) Histogram representations of CUT&RUN-qPCR quantitations of FLAG or the specified FLAG-PGC-1α variant binding to the promoter of three PGC-1α CBM-activated genes in THZ1-treated PGC-1α KD MBs. Values for PGC-1α KD MBs expressing FLAG-PGC-1α(WT) are set to 1. P-values are as shown in C.
See also Figure S4.
