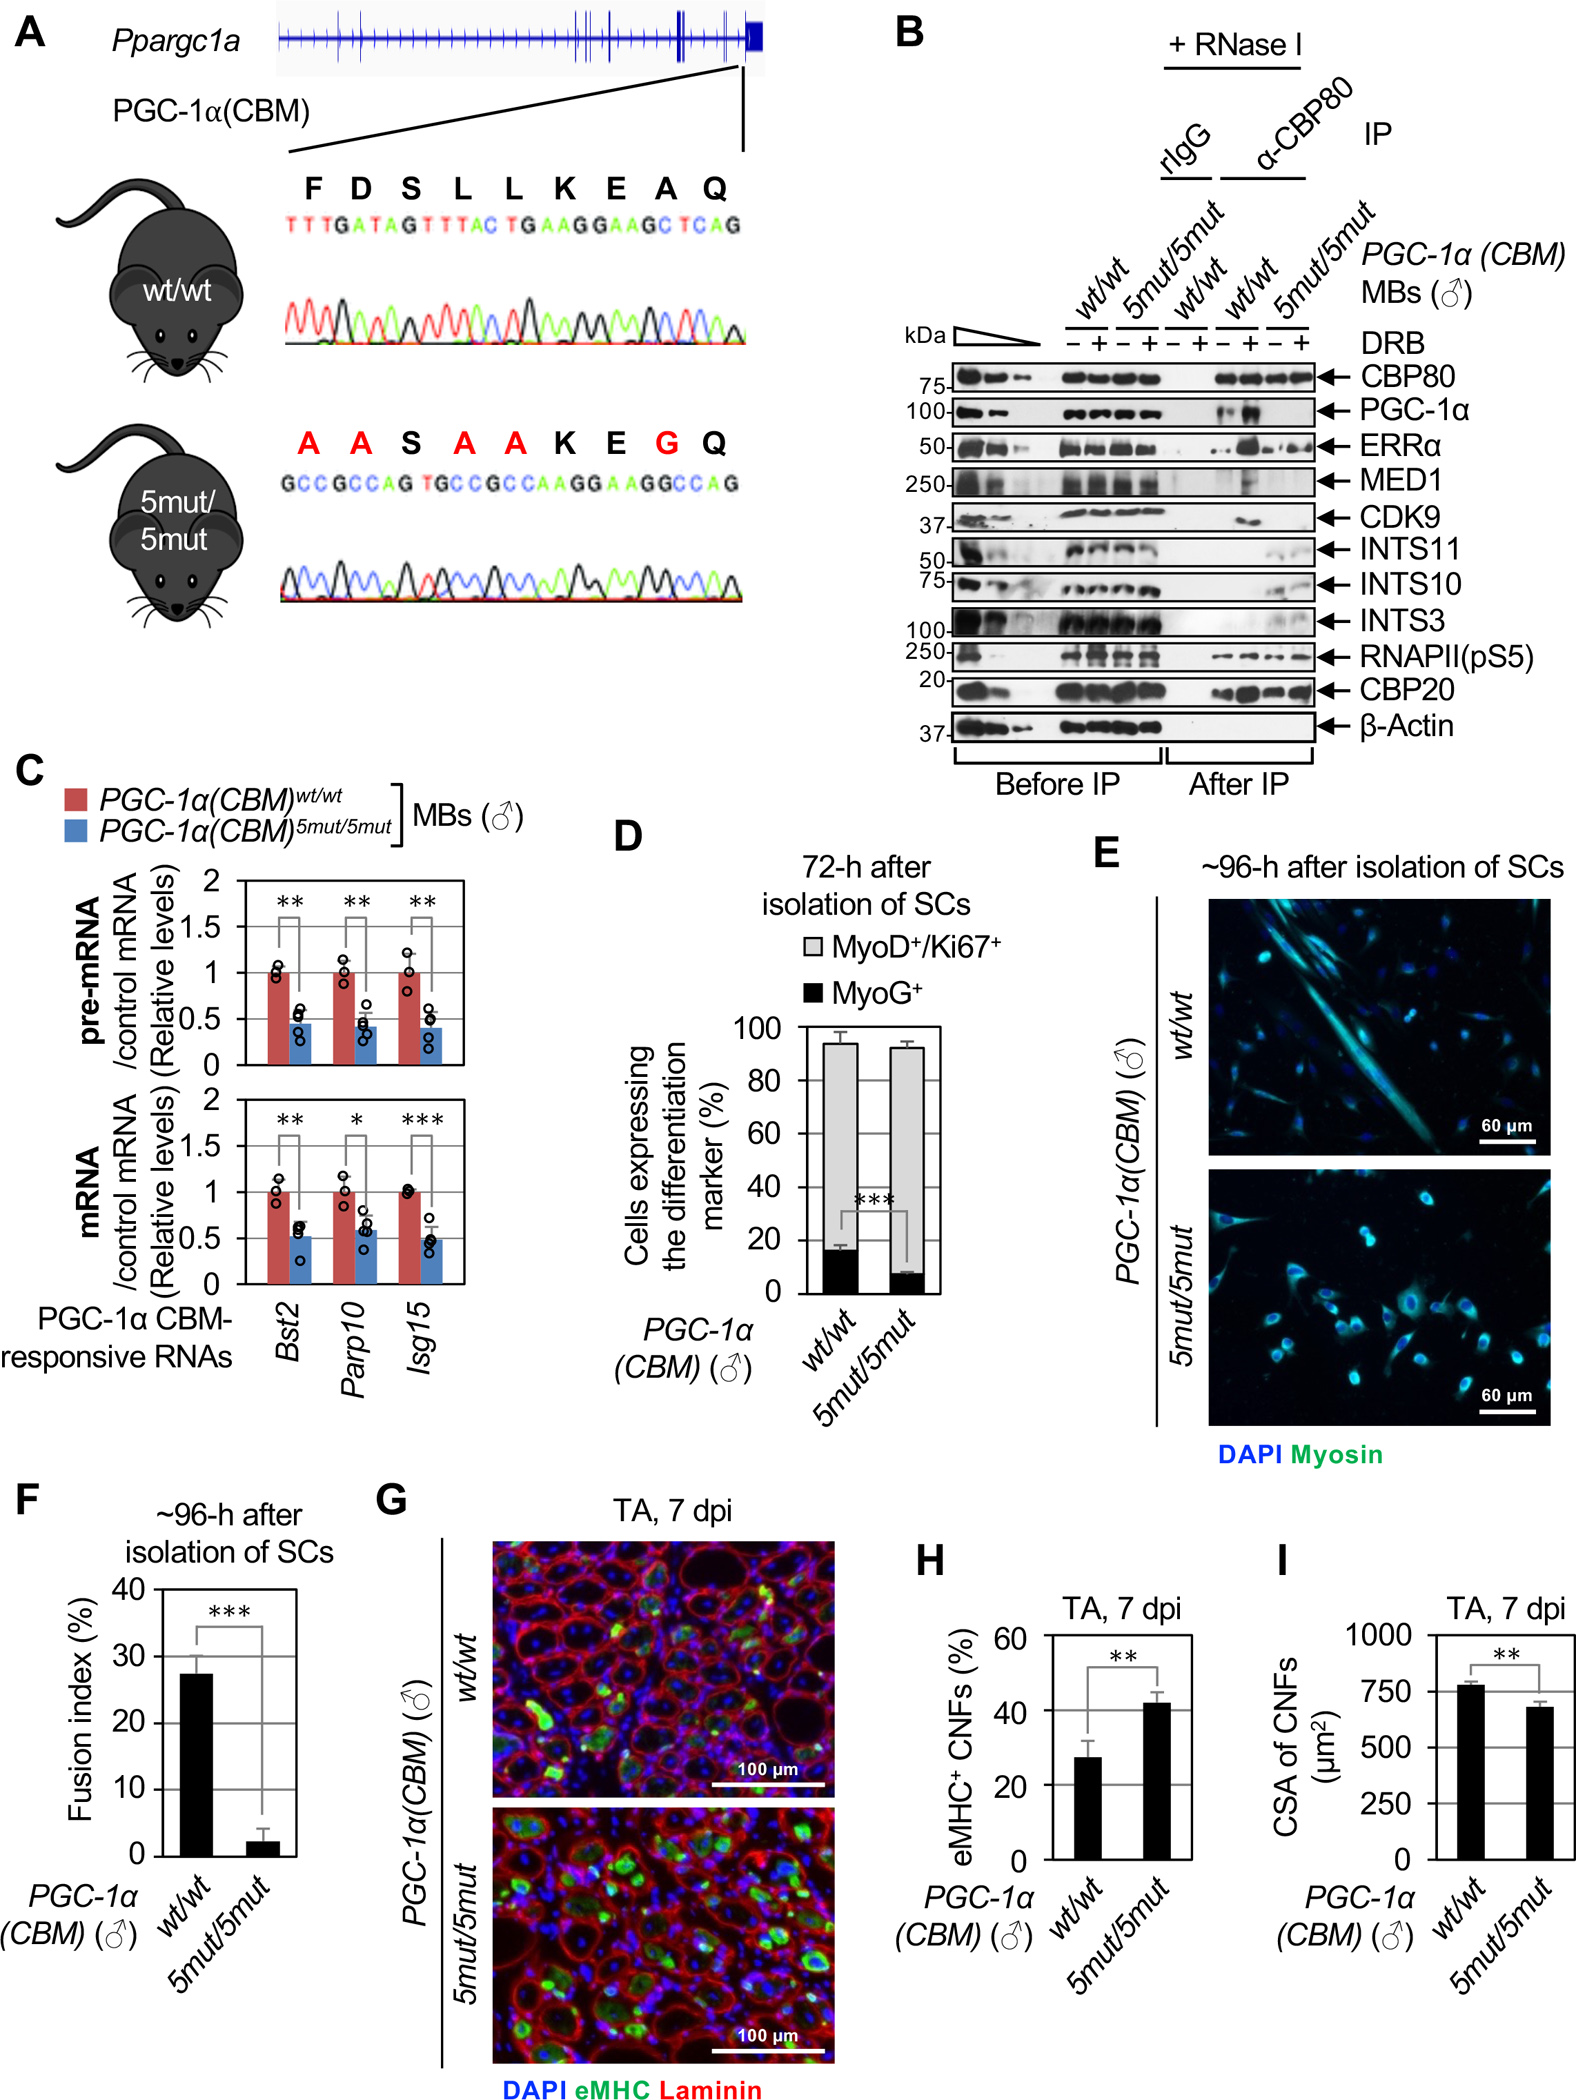
Figure 6. The P4RC is conserved in mouse skeletal muscle tissues and mediates the differentiation of primary MBs and muscle regeneration.

(A) Location of the CRISPR-Cas9-induced point-mutations inserted into both alleles of the mouse Ppargc1a gene to generate the PGC-1α(CBM)5mut/5mut mouse line. Large red letters above the gene sequence indicate changes in CBM residues that were made.
(B) WBs of lysates of primary MBs derived from male (♂) PGC-1α(CBM)5mut/5mut or PGC-1α(CBM)wt/wt mice, that were (+) or were not (−) treated with DRB, before or after IP in the presence of RNase I using α-CBP80 or, as a control, rIgG.
(C) As Figure 4H, but using lysates of primary MBs derived from male PGC-1α(CBM)5mut/5mut or PGC-1α(CBM)wt/wt mice. Here and for histograms below, results are means ± S.D. (n ≥ 3 biological replicates), P-values compare PGC-1α(CBM)5mut/5mut and PGC-1α(CBM)wt/wt using a two-tailed unpaired Student’s t-test. *, P < 0.05; **, P < 0.01; ***, P < 0.001; no asterisks, P ≥ 0.05.
(D) Histogram representations of the percentage of proliferating primary MBs (MyoD+/Ki67+, gray bars) and myocytes (MyoG+, black bars) derived from male PGC-1α(CBM)5mut/5mut or PGC-1α(CBM)wt/wt, 72-hours post-isolation of SCs (n = 4 mice).
(E) Representative images of immunofluorescence staining of Myosin (green) and nuclei (DAPI, blue) in SC cultures derived from male PGC-1α(CBM)5mut/5mut or PGC-1α(CBM)wt/wt, 96-hours post-isolation.
(F) Histogram representations of the fusion index, i.e. the percentage of cells having ≥ 3 nuclei, of SCs isolated and cultured as in E (n = 4 mice).
(G) Representative images of immunofluorescence staining of eMHC (green), Laminin (red), and nuclei (DAPI, blue) in transverse sections of injured tibialis anterior (TA) muscles from male PGC-1α(CBM)5mut/5mut or PGC-1α(CBM)wt/wt mice, isolated 7-days post BaCl2-induced injury (7 dpi).
(H) Histogram representations of the percentage of eMHC-positive centrally nucleated fibers (CNFs) in transverse sections of regenerating TA muscles (n =3 mice).
(I) As in H but for the cross-sectional area (CSA) of CNFs (n = 3 mice).
See also Figures S5,6 and Table S1.
