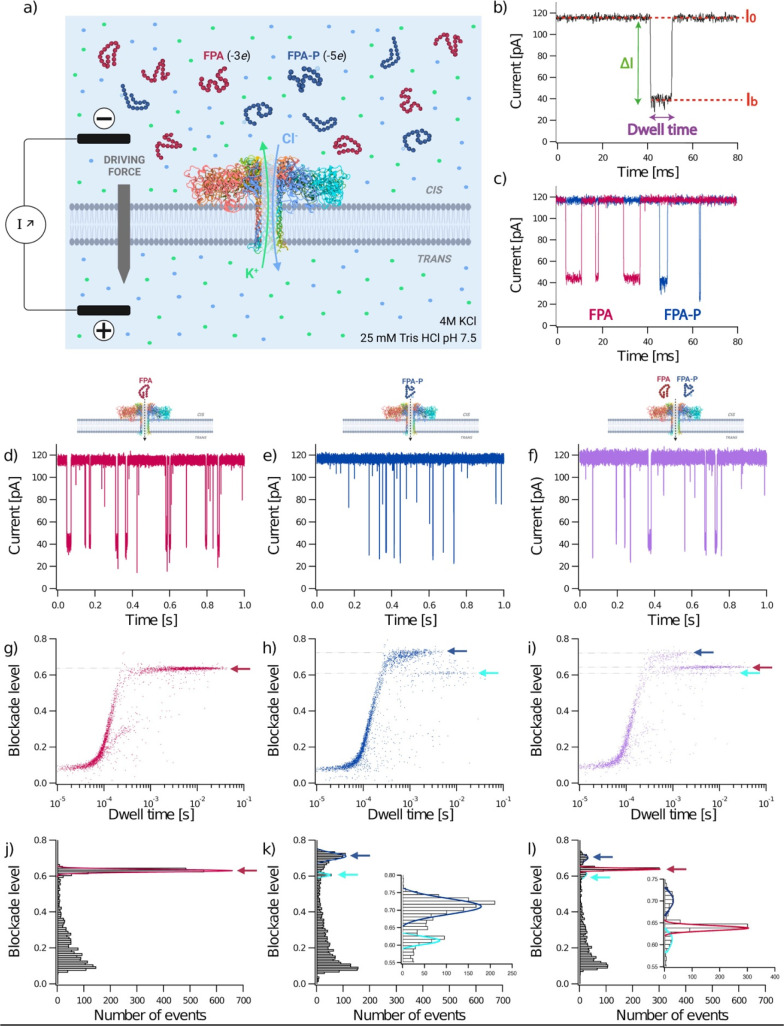
Figure 2.
Characterization and discrimination of a post-translational modification in a peptide biomarker. A depiction of the experimental setup (a) where FPA (red) and FPA-P (blue) peptides were analyzed separately at 40 μM final concentration (d,e,g,h) and together in an equimolar mixture [10 μM; purple data in (f,i), using a wild-type aerolysin nanopore (ribbon depiction of PDB: 5JZT)68 inserted in a lipid membrane. When a voltage is applied, K+ and Cl– ions (pale green and pale blue spheres) in the buffer flow through the pore (pale green and pale blue arrows], thereby resulting in an ionic current (I0; b). FPA peptides have a net negative charge of −3e and −5e for FPA and FPA-P, respectively (a). A typical current trace recorded over 80 ms (b), showing the open pore current (I0) and blockade current (Ib), blockade depth (ΔI), and dwell time of an analyte interaction or translocation event. Representative current traces recorded over 80 ms (c) for FPA (red) and FPA-P (blue) and over 1 s for FPA, FPA-P, and the mix (red, blue, and purple respectively; d–f). Representative scatter plots showing normalized blockade level, defined as (I0 – Ib)/I0, against dwell time for each blockade (g–i), where faint dotted lines trace from the center of event populations to the y axis for blockade level, and arrows denote the different populations (FPA, red; FPA-P1, blue; FPA-P2, cyan). Representative histograms of blockade level as a function of the number of blockades (j–l), with insets showing magnified views of the low frequency events (k,l). Red, blue, and cyan lines are Gaussian fits to determine the most probable mean-normalized blockade levels were 0.63 ± 0.01 for FPA (red), 0.71 ± 0.02 for the first population of FPA-P (FPA-P1, blue) and 0.61 ± 0.01 for the second population (FPA-P2, cyan). The three populations identified in the mixture have the following mean-normalized blockade levels: 0.64 ± 0.01 (red), 0.70 ± 0.02 (blue), and 0.61 ± 0.02 (cyan). All experiments were conducted at V = +50 mV in 4 M KCl, 25 mM Tris HCl, pH 7.5 buffer. Data shown are from a single recording for each experiment, with the fitted values being the mean and standard deviation for three independent fits. I0,FPA = 114.98 ± 1.67 pA; I0,FPA-P = 116.66 ± 1.60 pA; I0,mix = 118.25 ± 2.06 pA. NFPA = 3339 events; NFPA-P = 3259 events; Nmix = 2205 events.

