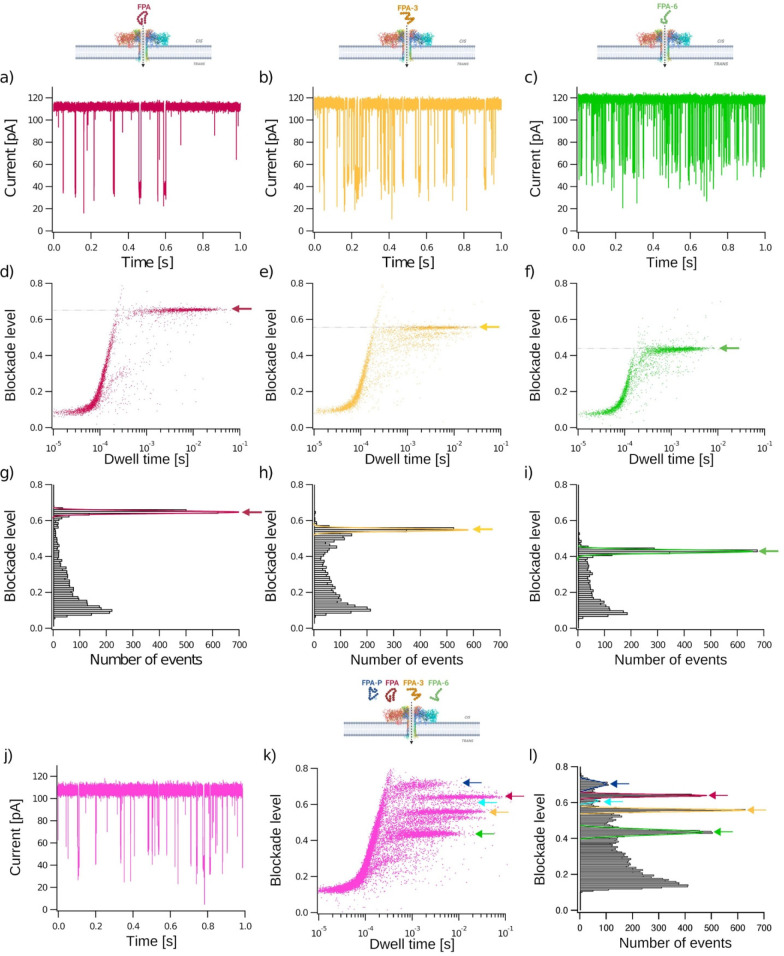
Figure 3.
Characterization and discrimination of different fibrinopeptide A biomarkers. FPA (red), FPA-3 (yellow), and FPA-6 (green) peptides were analyzed separately at a 40 μM final concentration (a–i) and in a mixture of FPA, FPA-P, FPA-3, and FPA-6 (j–l). Representative current traces recorded through a wild-type aerolysin nanopore (PDB:5JZT) over 1 s for each peptide and the mixture (a–c,j). Bidimensional scatter plots showing blockade level against dwell time for each event (d–f,k). Normalized blockade current is (I0 – Ib)/I0, where I0 is the open pore current, and Ib is the blockade current. Representative histograms of blockade level as a function of the number of events (g–i,l). Red, yellow and green lines are Gaussian fits to determine the most probable mean blockade level at 0.65 ± 0.01 for FPA, 0.55 ± 0.01 for FPA-3, and 0.43 ± 0.01 for FPA-6 (g–i). The five populations identified in the mixture of FPA (10 μM), FPA-P (20 μM), FPA-3 (10 μM), and FPA6 (2.5 μM) (l) have mean blockade levels of 0.70 ± 0.02 (FPA-P1, blue), 0.64 ± 0.01 (FPA, red), 0.62 ± 0.01 (FPA-P2, cyan), 0.56 ± 0.01 (FPA-3, yellow), and 0.44 ± 0.01 (FPA-6, green). All experiments were conducted at V = +50 mV, in 4 M KCl, 25 mM Tris pH 7.5 buffer. Data shown are from a single experiment, with the fitted values being the mean and standard deviation for three independent fits. I0,FPA= 112.02 ± 1.53 pA; I0,FPA-3 = 114.47 ± 1.87 pA; I0,FPA-6 = 118.78 ± 1.66 pA; I0,mix = 106.82 ± 2.57 pA. NFPA = 4474 events; NFPA-3 = 4230 events; NFPA-6 = 3742 events; Nmix = 19 435 events.

