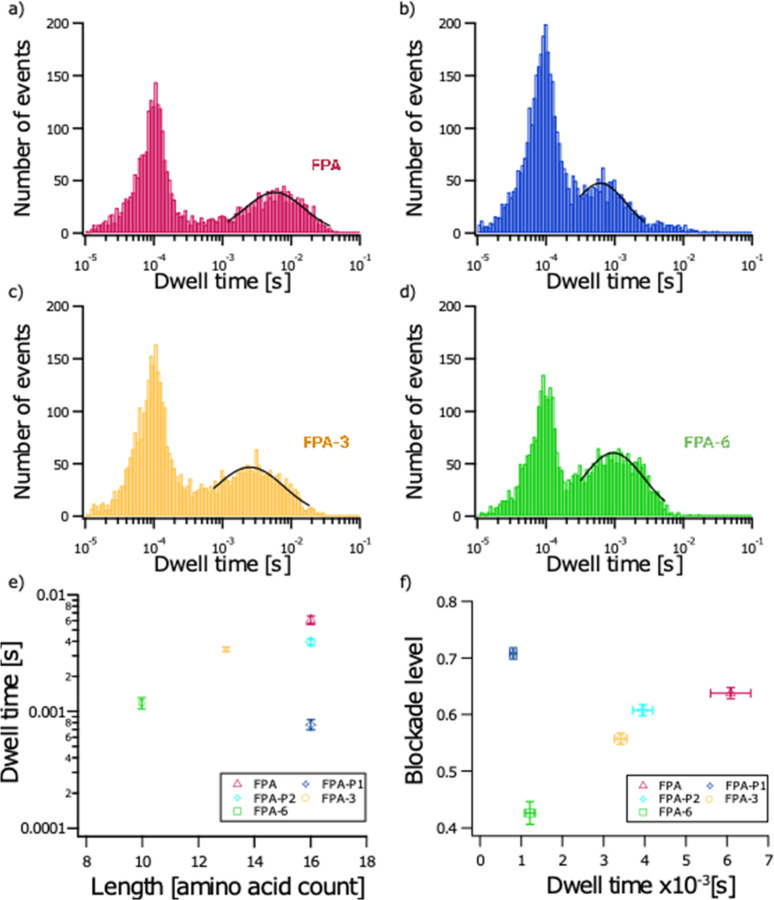
Figure 4.
Event durations of different fibrinopeptide A biomarkers. Representative histograms of the number of events as a function of dwell time for FPA (red; a), FPA-P (blue; b), FPA-3 (yellow; d), and FPA-6 (green; d) peptides. Black lines are log-normal fits used to determine the most probable dwell times. Data shown are from a single recording for each experiment (independent experiments from those shown in Figures 2 and 3). Mean dwell time and standard deviations calculated from three independent fits to the data were: 5.74 ± 0.22 ms (FPA, red); 0.62 ± 0.04 ms (FPA-P1, blue); 4.41 ms ± 0.33 ms (FPA-P2, cyan); 2.50 ± 0.12 ms (FPA-3, yellow); and 0.95 ± 0.04 ms (FPA-6, green). NFPA = 3339 events; NFPA-P = 4309 events; NFPA-3 = 4230 events; NFPA-6 = 3742 events (a–d). Plot showing mean and standard deviation of dwell time (calculated from the fits to data from three independent experiments) as a function of peptide length: 6.09 ± 0.49 ms (FPA, red); 0.77 ± 0.08 ms (FPA-P1, blue); 3.94 ± 0.24 ms (FPA-P2, cyan); 3.40 ± 0.15 ms (FPA-3, yellow); 1.18 ± 0.13 ms (FPA-6, green) (e). Plot showing mean and standard deviations for dwell time as a function of blockade level for each peptide calculated from the fits to data from three independent experiments: 0.64 ± 0.01 (FPA, red); 0.71 ± 0.01 (FPA-P1, blue); 0.61 ± 0.01 (FPA-P2, cyan); 0.56 ± 0.01 (FPA-3, yellow); and 0.43 ± 0.02 (FPA-6, green) (f).

