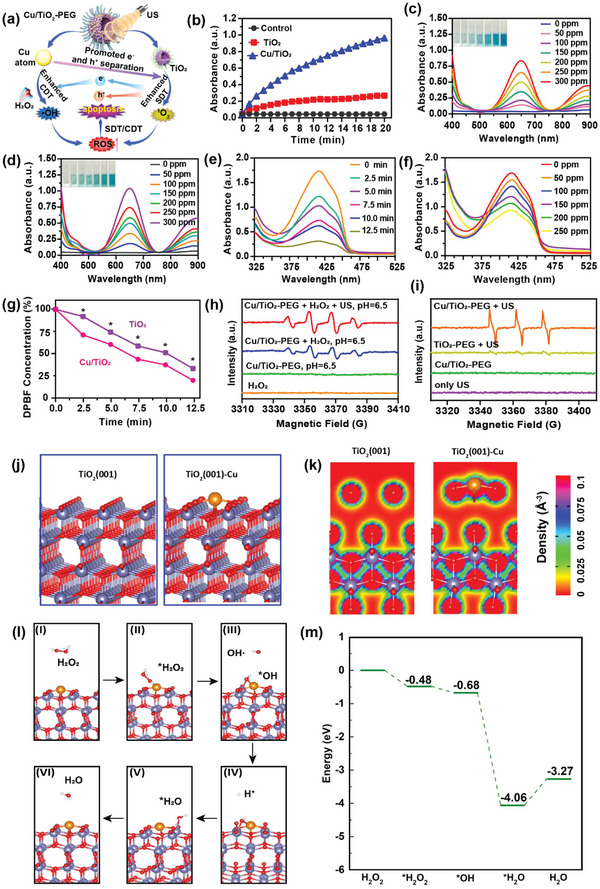
Figure 2.

In vitro sono/chemo‐dynamic performance of single‐atom Cu/TiO2 nanosonosensitizers and density functional theory calculations. a) Schematic illustration of synergistically enhanced ROS generation of single‐atom Cu/TiO2 nanosonosensitizers under US irradiation. b) Time‐course absorbance of TMB to assess the ·OH generation capability of TiO2 and Cu/TiO2 through UV–vis measurement. c,d) UV–vis absorbance of TMB to evaluate the ·OH generation of Cu/TiO2 without c) or with d) US irradiation at different concentrations (0, 50, 100, 150, 200, 250, and 300 ppm). e) UV–vis absorbance of Cu/TiO2 containing DPBF exposure to US irradiation for different durations (0, 2.5, 5, 7.5, 10, and 12.5 min). f) UV–vis absorbance of Cu/TiO2 containing DPBF exposure to US irradiation (power density: 1.0 W cm−2, duty cycle: 50%, 5 min) at different concentrations (0, 50, 100, 150, 200, and 250 ppm). g) Relative absorption of DPBF after co‐incubation with Cu/TiO2 or TiO2 under US irradiation for different durations. h) BMPO and i) TEMP spin‐trapping ESR spectra of Cu/TiO2 under different conditions. j) Schematics and k) charge densities of pure TiO2(001) facet and Cu‐doped TiO2(001) facet (TiO2(001)‐Cu). l) The POD‐like activity catalytic mechanism and m) the energy diagram of the Cu‐doped TiO2(001) surface. The purple, orange, red, and white balls indicate the Ti, Cu, O, and H atoms, respectively. *P< 0.05, **P< 0.01, ***P<0.001, ****P<0.0001 and ns for non‐significant.
