
Figure 4.
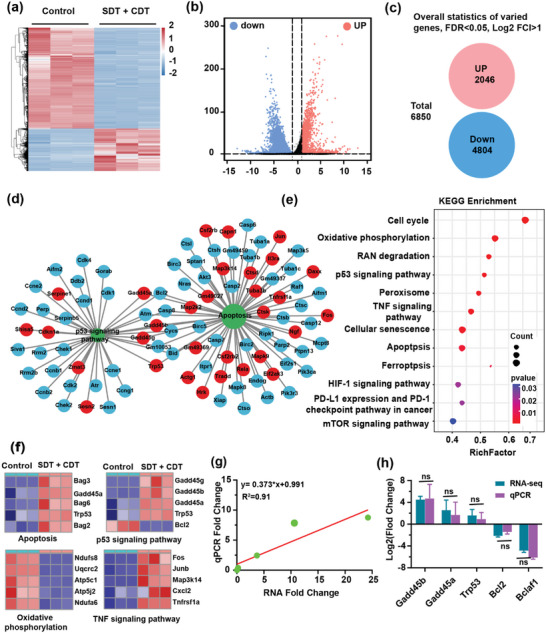
The underlying mechanism of enhanced sono/chemo‐dynamic treatments of breast cancer with single‐atom Cu/TiO2‐PEG nanosonosensitizers by transcriptome high‐throughput sequencing. a) Heat map and b) volcano map of expressed genes involved in the synergistically therapeutic progress. c) Overall statistics of 6850 varied genes including 2046 up‐regulations and 4804 down‐regulations. d) Functional protein interaction network analysis of differentially expressed genes. e) Bubble diagram of differential genes expression in KEGG analysis. f) Heatmaps of differentially expressed genes associated with P53, apoptosis, oxidative phosphorylation, and TNF signaling pathway. g) Correlation analysis between RNA‐seq and qRT‐PCR genes differential expression. h) Comparative analysis of RNA‐seq and qRT‐PCR gene expression (n = 3). *P< 0.05, **P< 0.01, ***P<0.001, ****P<0.0001 and ns for non‐significant.