
Figure 1.
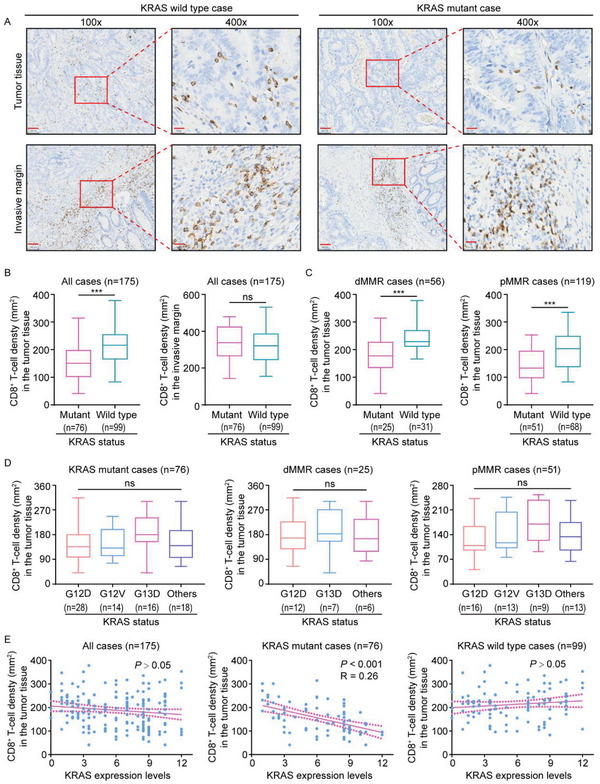
Clinical correlation between mutant KRAS and intratumoral cytotoxic CD8+ T‐cells. A) CD8 immunostaining within tumor tissue and invasive margin in a representative human CRC case carrying mutant KRAS compared to a KRAS wild‐type case. B) Quantification of CD8+ T‐cells within tumor tissues and invasive margin in KRAS mutant (n = 76) and KRAS wild‐type cases (n = 99). C) Statistical analysis of CD8+ T‐cells within tumor tissues in dMMR (n = 56) and pMMR cases (n = 119). D) Statistics of CD8+ T‐cells within the tumor tissues in 76 CRC patients of KRAS mutations (Left panel, Others include KRAS G12C (n = 4), G12R (n = 2), G12S (n = 6), G13C (n = 1), K117N (n = 1), A146T (n = 2), and Q61H (n = 2) mutations), and in 25 CRC patients of dMMR (Middle panel, Others include KRAS G12V (n = 1), K117N (n = 1), A146T (n = 2), and Q61H (n = 2) mutations), and in 51 CRC patients of pMMR (Right panel, Others include KRAS G12C (n = 4), G12R (n = 2), G12S (n = 6), and G13C (n = 1) mutations). E) Pearson's correlation analysis between KRAS expression levels and CD8+ T‐cell density in CRC tissues. Scare bars, 100 µm (A), ***P ≤ 0.001, and ns indicates P > 0.05, by two‐tailed Student's t‐test (B,C), one‐way ANOVA (D), or Person's correlation analysis (E).