
Figure 5.
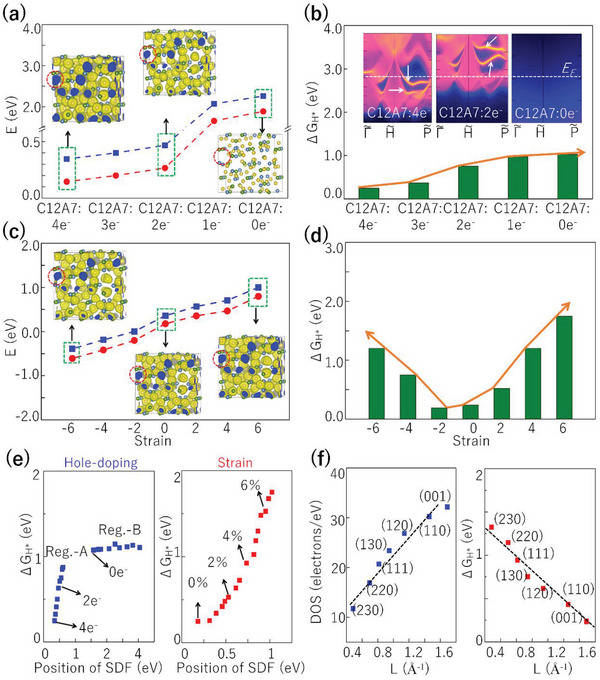
a) The positions of SDP (blue line) and FDP (red line) in C12A7:4e− with different charge states. The insets in (a) provide the ELF maps for C12A7:4e−/:2e−/:0e−, where the isosurface values are 0.65. b) The ΔGH* of the (001) surface in C12A7:4e− with different charge states. The insets in (b) show the corresponding (001) surface states for C12A7:4e−/:2e−/:0e−. c) The energy position of SDP and FDP corresponding to the Fermi level under hydrostatic distortions from −6% to +6%, where negative and positive values denote lattice compression and lattice expansion, respectively. The insets in (c) provide the ELF maps of electride C12A7:4e− under −6%, 0%, and +6% lattice distortions, where the isosurface values are 0.65. d) The change of ΔGH* on the (001) surface of C12A7:4e− under different lattice distortions. e) The change of ΔG H* on different positions of SDF by hole‐doping and strain. f) The linear relationship between Fermi arc length (L) of different surfaces and the corresponding surface DOSs (the left panel) and the catalytic ΔG H* (the right panel).