
Figure 3.
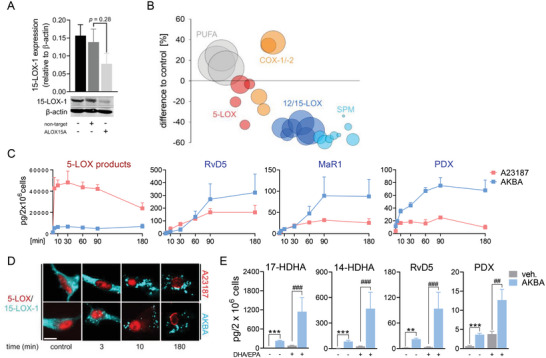
AKBA elevates 12/15‐LOX products involving 15‐LOX‐1 in M2‐MDM. A,B) MDMs (2 × 10⁶ cells mL−1) differentiated from human monocytes for 6 days with M‐CSF were transfected with non‐target or ALOX15A siRNA during polarization with IL‐4 (20 ng mL−1) for 48 h. A) Western blot analysis of 15‐LOX‐1; β‐actin served as reference protein for normalization after densitometric analysis, n = 4; Student´s unpaired t‐test. B) LM profile of ALOX15A siRNA‐treated M2‐MDMs after exposure to AKBA (10 µm) for 180 min, n = 4. Data are shown as bubble blot in % of non‐target siRNA of LM summarized in groups: 12/15‐LOX products include 17‐HDHA, 15‐HETE, 15‐HEPE, 14‐HDHA, 12‐HETE, and 12‐HEPE; SPM include PD1, PDX, RvD2, RvD5, and MaR1; 5‐LOX products include t‐LTB4, LTB4, 5‐HETE, and 5‐HEPE; COX products include PGE2, PGD2, TXB2, and PGF2α ; PUFA include AA, EPA, and DHA. C) Kinetic of LM formation in M2‐MDMs after incubation with 10 µm AKBA or 2.5 µm A23187 in the presence of AA, EPA, and DHA (1 µm each). After the indicated time points, formed LM were isolated from the supernatants by SPE and analyzed by UPLC‐MS‐/MS. Data are shown as means ± S.E.M. given in pg/2 × 106 cells for representative SPM and for the sum of 5‐LOX products, including t‐LTB4, LTB4, 5‐HETE, and 5‐HEPE; n = 3 separate donors. D) Subcellular redistribution of 5‐LOX and 15‐LOX‐1 in M2‐MDMs after exposure to AKBA (10 µm) or A23187 (2.5 µm) for indicated time points. Cells were fixed, permeabilized, and incubated with antibodies against 5‐LOX (red) and 15‐LOX‐1 (cyan‐blue); scale bar = 10 µm. Results shown for one single cell are representative for ≈100 individual cells analyzed in n = 3 independent experiments with separate donors, each. E) M2‐MDMs where co‐incubated with or without 3 µg mL−1 of DHA and EPA, each, and with AKBA (10 µm) or vehicle (0.1% DMSO) for 180 min at 37 °C. Formed LM were isolated from supernatants by SPE and analyzed by UPLC‐MS‐MS. Data are means ± S.E.M., given in pg/2 × 106 cells, n = 4 independent experiments. For statistical analysis, data were log‐transformed, one‐way analysis of variance (ANOVA) with Tukey's test, **p < 0.01, ***p < 0.001 vehicle control versus AKBA; #p < 0.05, ##p < 0.01 vehicle + supplement versus AKBA + supplement.