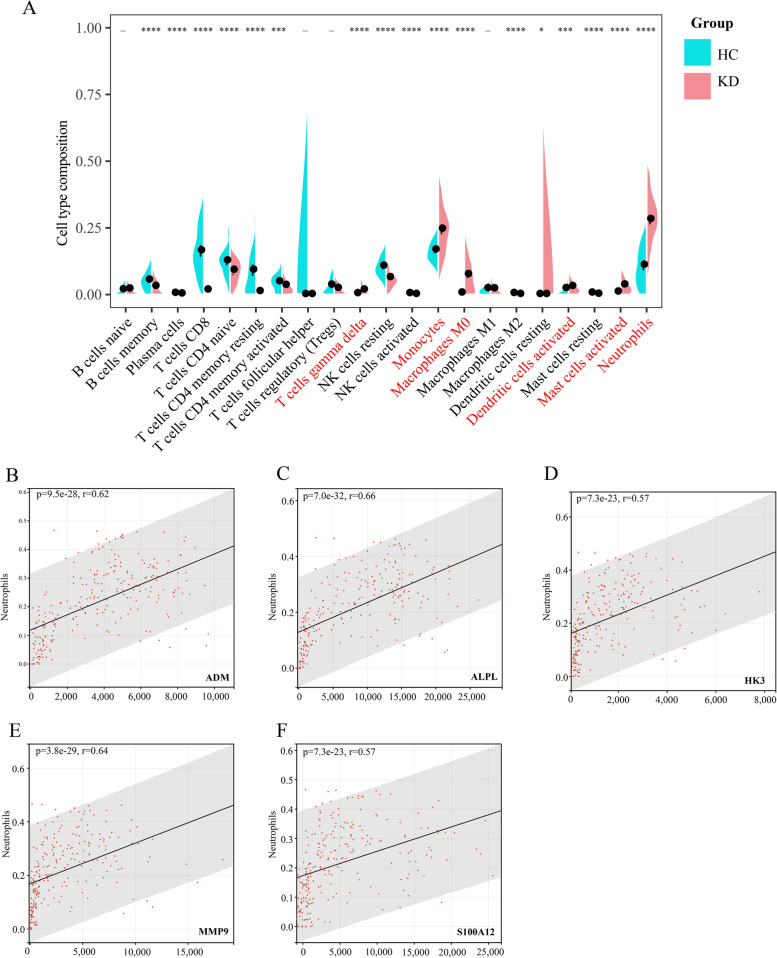
Fig. 5.
Immune cell infiltration and correlation with genes. A Comparison of 22 immune cell subtypes between KDs and HCs. p-values are obtained by the Wilcoxon test. Pink and turquoise color represent KDs and HCs, respectively (_: non-significant, *P < 0.05, **P < 0.01, ***P < 0.001, ****P < 0.0001) (The fraction of eosinophils is zero.). The immune cells displayed with red color are upregulated prominently in KD. Correlation between ADM and neutrophils (B); ALPL and neutrophils (C); HK3 and neutrophils (D); MMP9 and neutrophils (E); S100A12 and neutrophils (F). “r” means the correlation coefficient between nodes and immune cells

