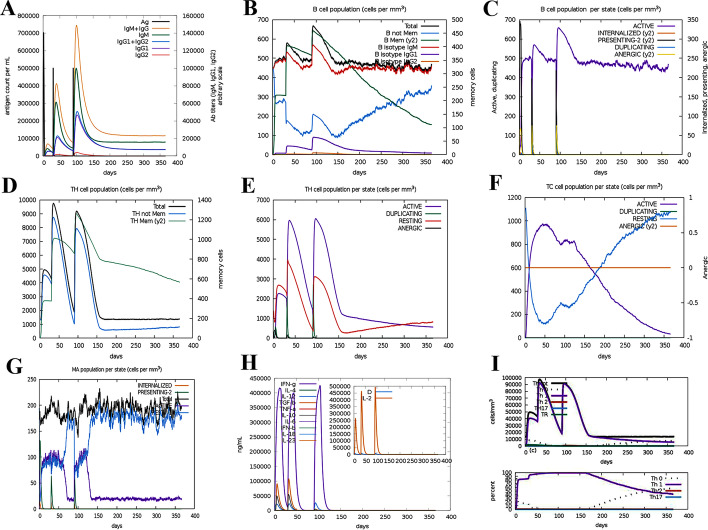
Fig. 10.
Immunization simulation results by C-ImmSim of the construct of multi-epitope vaccine as an antigen. A Demonstration of immunoglobulin production in response to antigen injection after vaccine administration, shown as different color peaks. B B cell population after three vaccine injections, which indicates an increase in different types of B cells and their class-switching potential. C Displays the population results per state of B cell. D The evolution of T-helper cells. E Population per state of T-helper cell. F Production of cytotoxic-T cells after vaccine injection. G Macrophages population per state. H Induction of cytokines and interleukins (increased production of IFN-γ and IL-2) after vaccination. I Th1-mediated immune response

