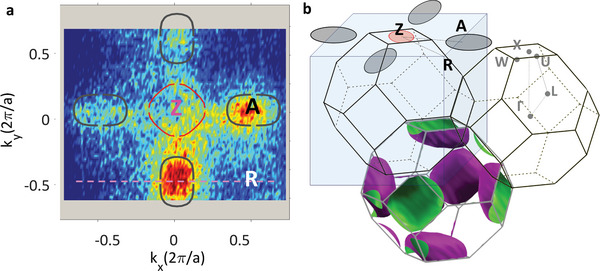
Figure 2.

Signature of RH reconstruction. In‐plane (kx ,ky ) iso‐E maps of PZT recorded with hv = 465 eV at 0.5 eV below the VBM in the ZAR plane of the TG cell. The red line indicates the calculated isocontour at the corresponding energy assuming TG geometry of the unit cell. Gray contours represent the additional signature of the RH‐distorted unit cell for DW (a). Such a signature is absent for the UP sample. The signature of the RH distortion is rendered into the TG unit cell in (b), with the iso‐energy surfaces calculated at the same energy, 0.5 eV below VBM, as the experimental maps.
